 11
11peptides
spectra
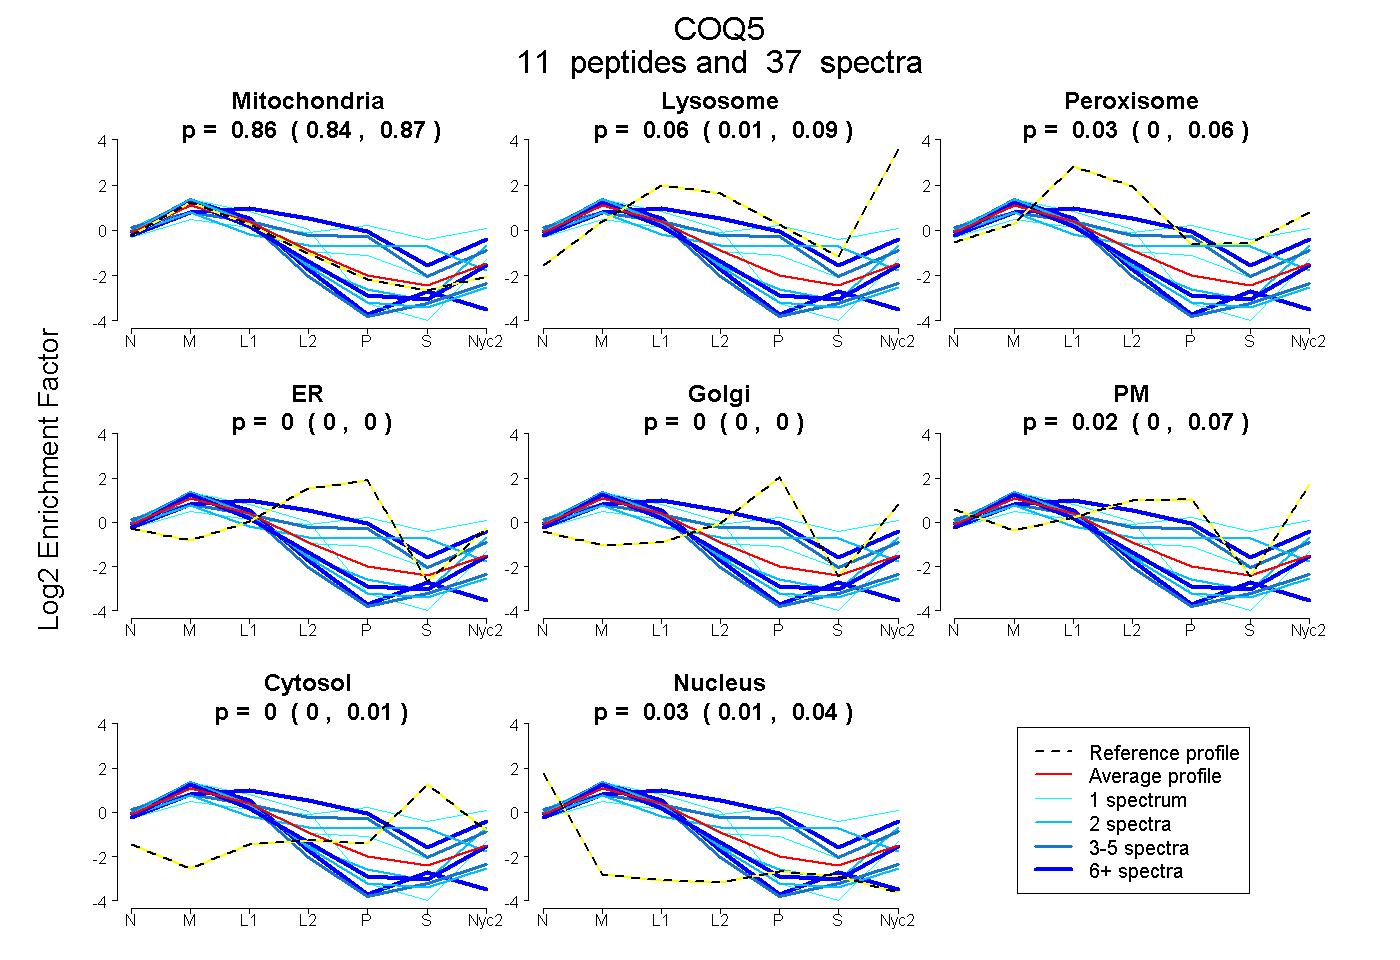
0.838 | 0.872
0.009 | 0.088
0.004 | 0.058
0.000 | 0.000
0.000 | 0.000
0.000 | 0.068
0.000 | 0.010
0.005 | 0.039
| Plot | Mito | Lyso | Perox | ER | Golgi | PM | Cytosol | Nucleus | |||||
| Expt A |
11 peptides |
37 spectra |
|
0.855 0.838 | 0.872 |
0.059 0.009 | 0.088 |
0.034 0.004 | 0.058 |
0.000 0.000 | 0.000 |
0.000 0.000 | 0.000 |
0.021 0.000 | 0.068 |
0.000 0.000 | 0.010 |
0.030 0.005 | 0.039 |
| 2 spectra, NVTHIDR | 0.559 | 0.000 | 0.061 | 0.129 | 0.000 | 0.000 | 0.251 | 0.000 | ||
| 8 spectra, VYQVFQSVAR | 0.981 | 0.000 | 0.000 | 0.000 | 0.000 | 0.000 | 0.000 | 0.019 | ||
| 1 spectrum, DMIEDAGFQK | 0.199 | 0.055 | 0.266 | 0.000 | 0.290 | 0.000 | 0.190 | 0.000 | ||
| 1 spectrum, FLCLEFSQVNDPLISR | 0.942 | 0.045 | 0.013 | 0.000 | 0.000 | 0.000 | 0.000 | 0.000 | ||
| 7 spectra, LAGDCR | 0.338 | 0.000 | 0.377 | 0.143 | 0.142 | 0.000 | 0.000 | 0.000 | ||
| 2 spectra, ALQEAHR | 0.860 | 0.097 | 0.000 | 0.000 | 0.000 | 0.000 | 0.000 | 0.043 | ||
| 4 spectra, FLSYVQTQHER | 0.536 | 0.000 | 0.112 | 0.092 | 0.162 | 0.097 | 0.000 | 0.000 | ||
| 1 spectrum, AAETHFGFETVSEK | 0.726 | 0.070 | 0.000 | 0.000 | 0.066 | 0.120 | 0.019 | 0.000 | ||
| 6 spectra, EDPLGGSLVMVCDINR | 0.902 | 0.000 | 0.000 | 0.000 | 0.000 | 0.000 | 0.000 | 0.098 | ||
| 2 spectra, VLKPGGR | 0.943 | 0.000 | 0.000 | 0.000 | 0.000 | 0.000 | 0.000 | 0.057 | ||
| 3 spectra, SYQYLVESIR | 0.918 | 0.000 | 0.000 | 0.000 | 0.000 | 0.000 | 0.000 | 0.082 |
| Plot | Mito | Lyso or Perox | ER | Golgi | PM | Cytosol | Nucleus | ||||||
| Expt B |
6 peptides |
14 spectra |
 |
0.980 0.966 | 0.990 |
0.000 0.000 | 0.000 |
0.000 0.000 | 0.000 |
0.000 0.000 | 0.000 |
0.000 0.000 | 0.000 |
0.000 0.000 | 0.000 |
0.020 0.006 | 0.031 |
|||
| Plot | Lyso | Other | |||||||||||
| Expt C |
12 peptides |
73 spectra |
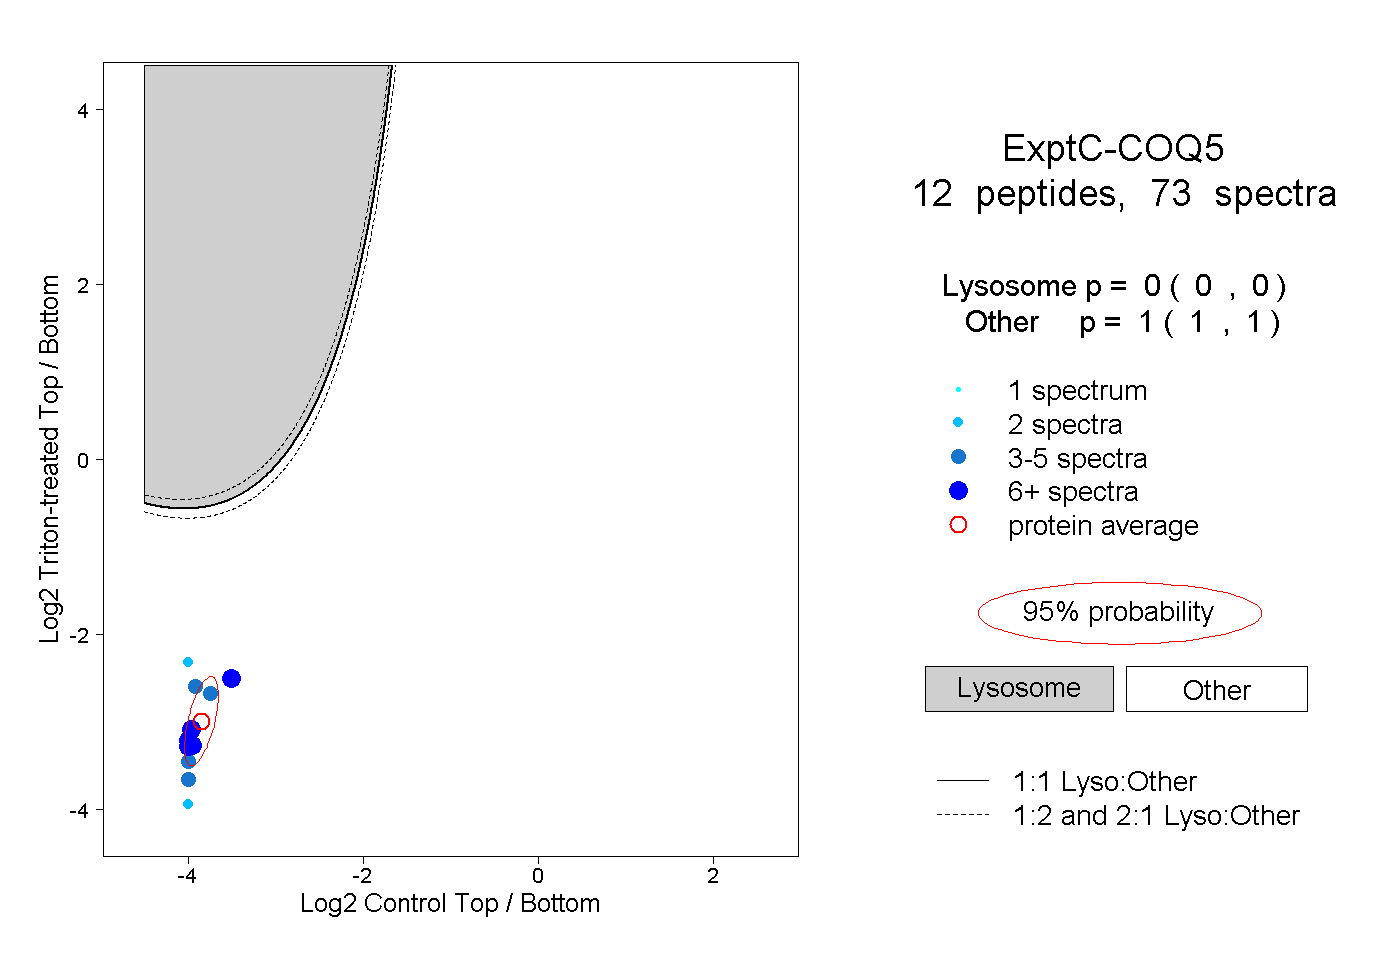 |
0.000 0.000 | 0.000 |
1.000 1.000 | 1.000 |
||||||||
| Plot | Lyso | Other | |||||||||||
| Expt D |
3 peptides |
4 spectra |
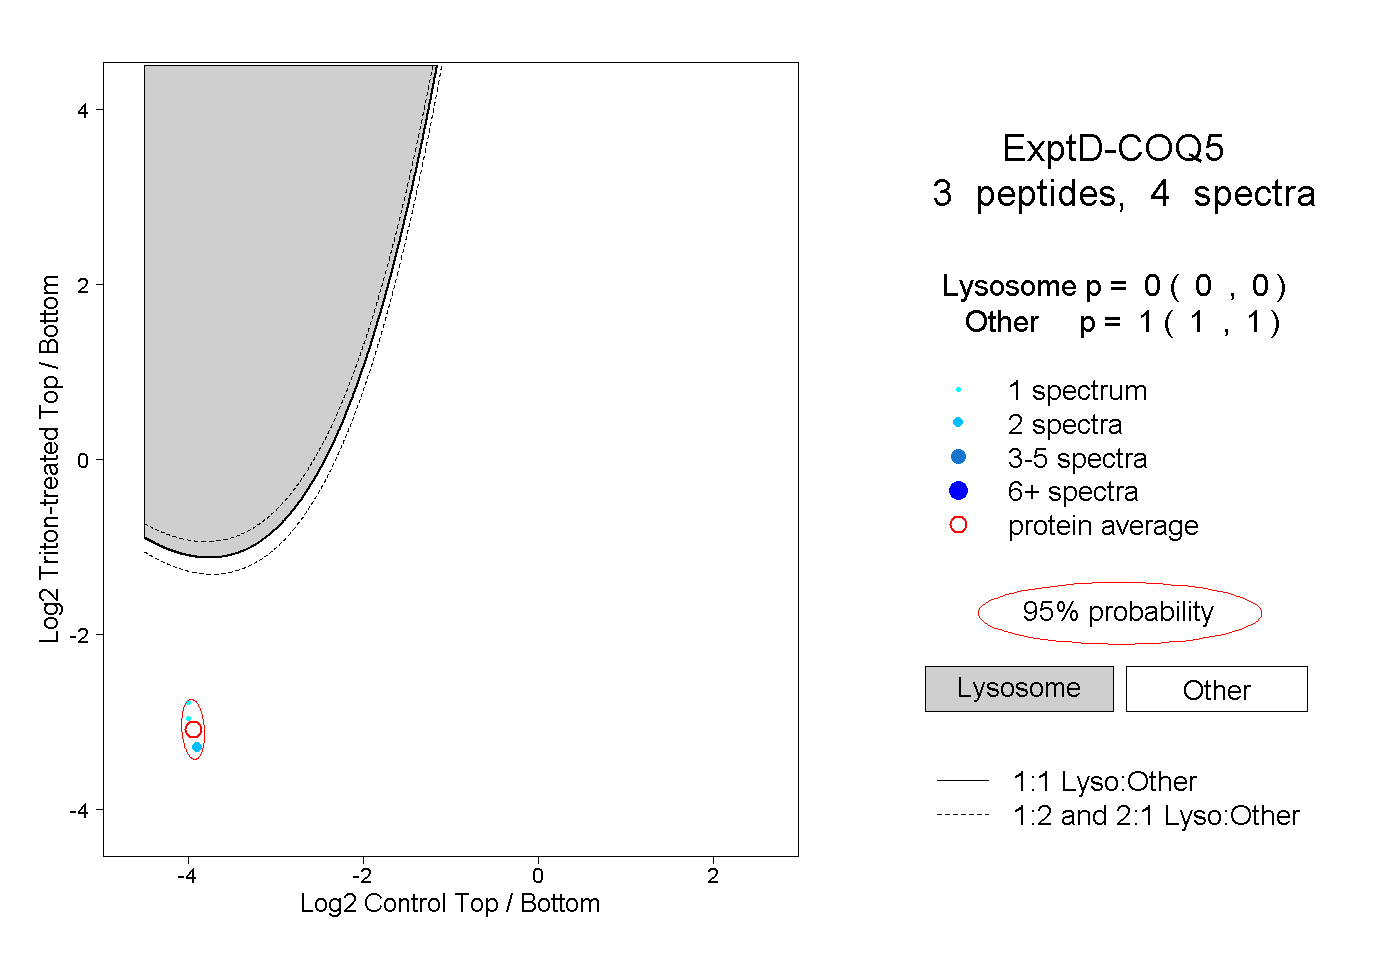 |
0.000 0.000 | 0.000 |
1.000 1.000 | 1.000 |