COQ5
[ENSRNOP00000001547]
Main page
| | | Plot |
Mito |
Lyso |
|
Perox |
ER |
Golgi |
PM |
Cytosol |
Nucleus |
|
| Expt A |
 11
11
peptides |
37
spectra |
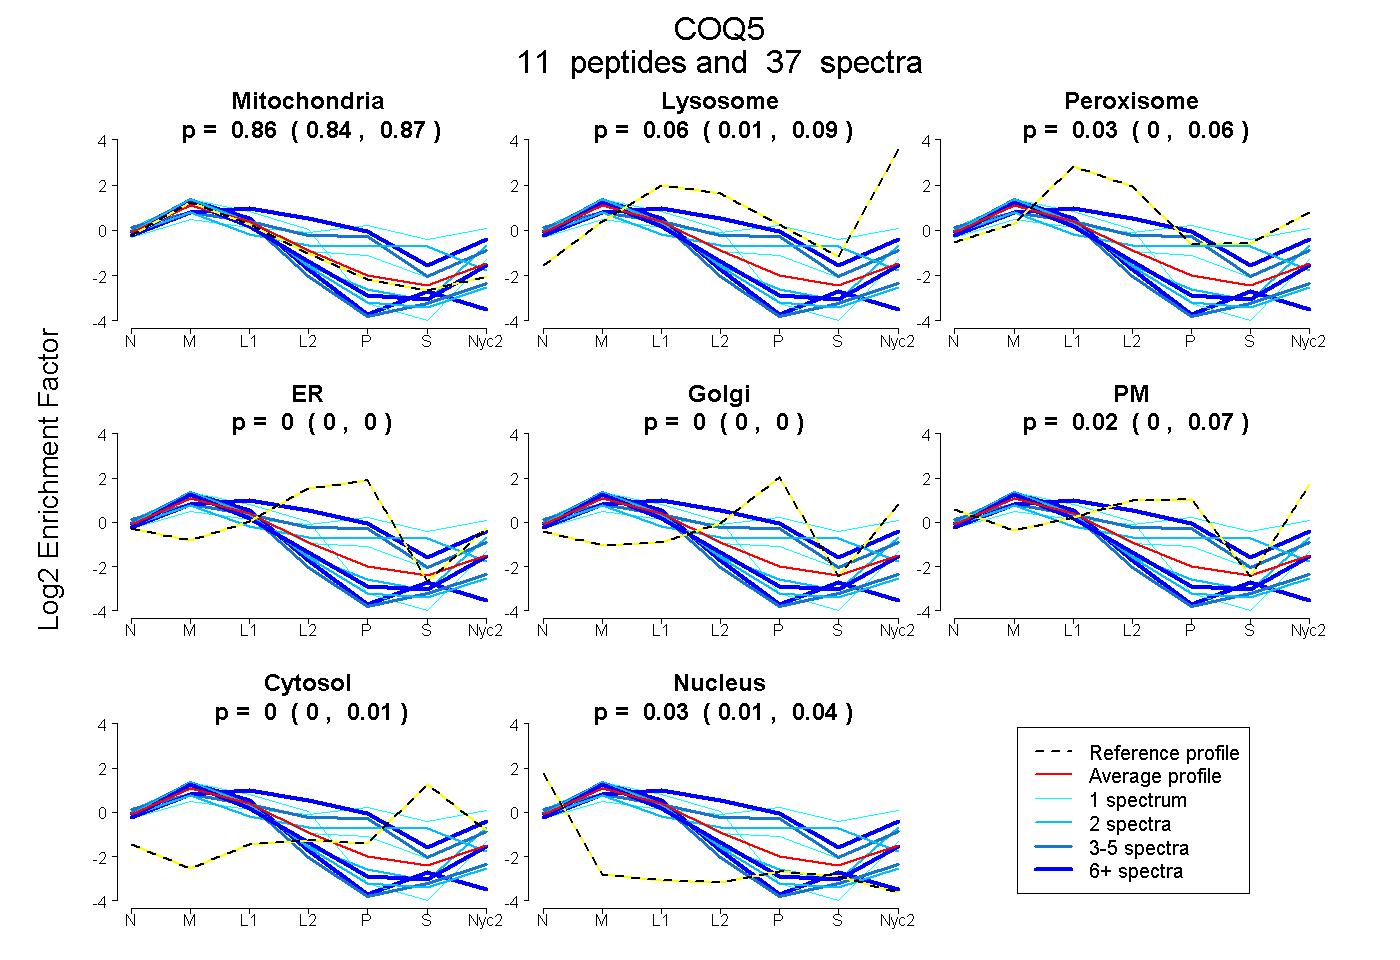 |
0.855
0.838 | 0.872 |
0.059
0.009 | 0.088 |
|
0.034
0.004 | 0.058 |
0.000
0.000 | 0.000 |
0.000
0.000 | 0.000 |
0.021
0.000 | 0.068 |
0.000
0.000 | 0.010 |
0.030
0.005 | 0.039 |
|
| | | Plot |
Mito |
|
Lyso or Perox |
|
ER |
Golgi |
PM |
Cytosol |
Nucleus |
|
| Expt B |
6
peptides |
14
spectra |
 |
0.980
0.966 | 0.990 |
|
0.000
0.000 | 0.000 |
|
0.000
0.000 | 0.000 |
0.000
0.000 | 0.000 |
0.000
0.000 | 0.000 |
0.000
0.000 | 0.000 |
0.020
0.006 | 0.031 |
|
| 2 spectra, QNLSWEEIAR |
0.985 |
|
0.003 |
|
0.000 |
0.000 |
0.000 |
0.000 |
0.012 |
|
| 6 spectra, VYQVFQSVAR |
0.957 |
|
0.000 |
|
0.000 |
0.000 |
0.000 |
0.000 |
0.043 |
|
| 1 spectrum, NVTHIDR |
0.771 |
|
0.120 |
|
0.000 |
0.000 |
0.000 |
0.109 |
0.000 |
|
| 2 spectra, DLLIR |
0.464 |
|
0.041 |
|
0.009 |
0.000 |
0.486 |
0.000 |
0.000 |
|
| 1 spectrum, FLSYVQTQHER |
1.000 |
|
0.000 |
|
0.000 |
0.000 |
0.000 |
0.000 |
0.000 |
|
| 2 spectra, SYQYLVESIR |
0.929 |
|
0.000 |
|
0.000 |
0.000 |
0.000 |
0.000 |
0.071 |
|
| | | Plot |
|
Lyso |
|
|
|
|
|
|
|
Other |
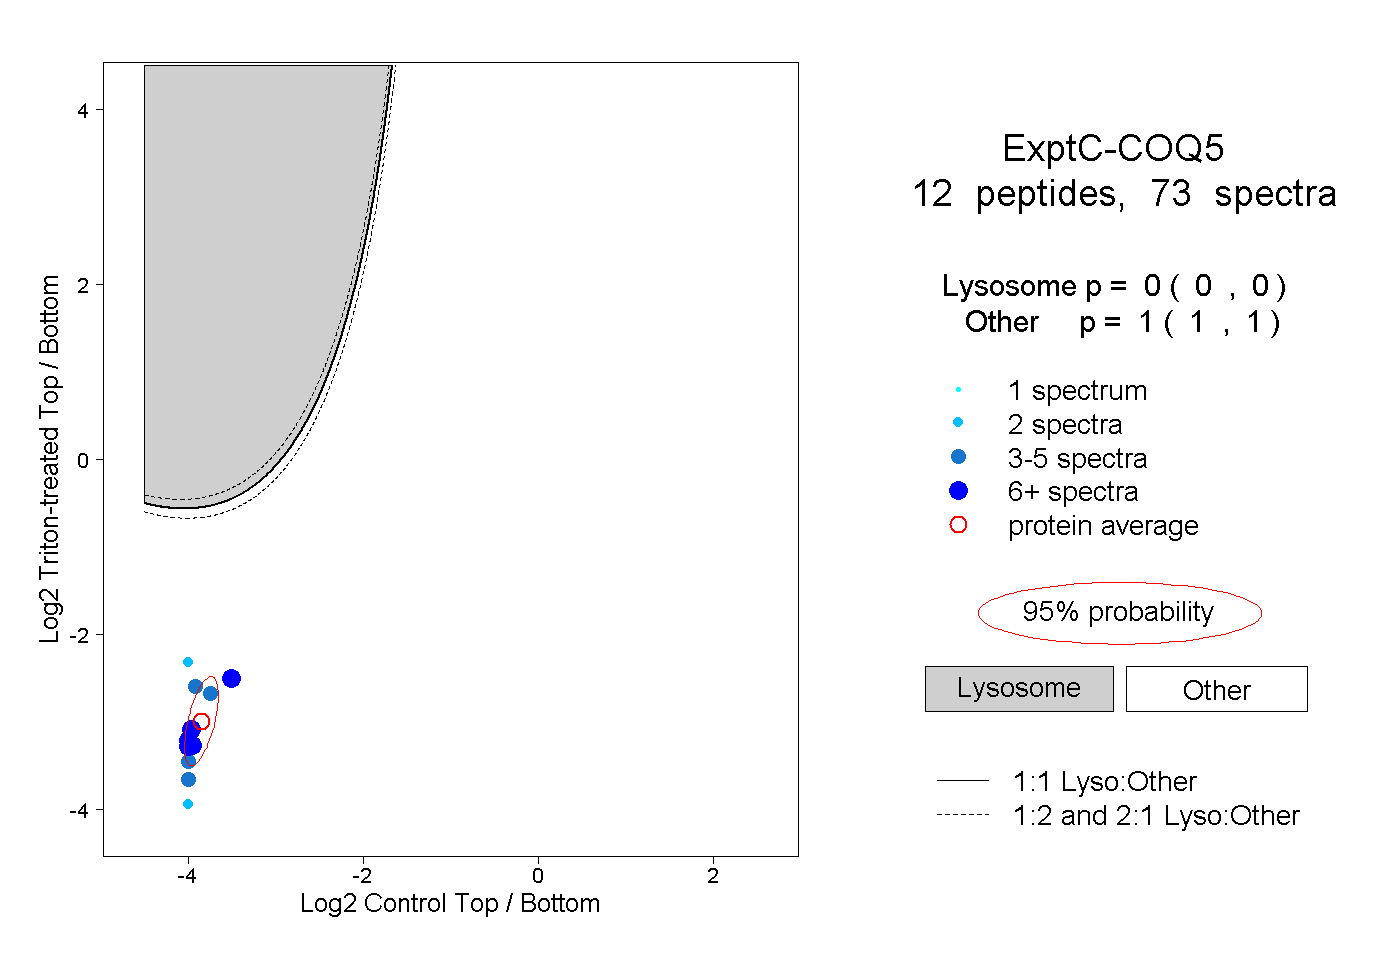
| Expt C |
12
peptides |
73
spectra |
 |
|
0.000
0.000 | 0.000 |
|
|
|
|
|
|
|
1.000
1.000 | 1.000 |
| | | Plot |
|
Lyso |
|
|
|
|
|
|
|
Other |
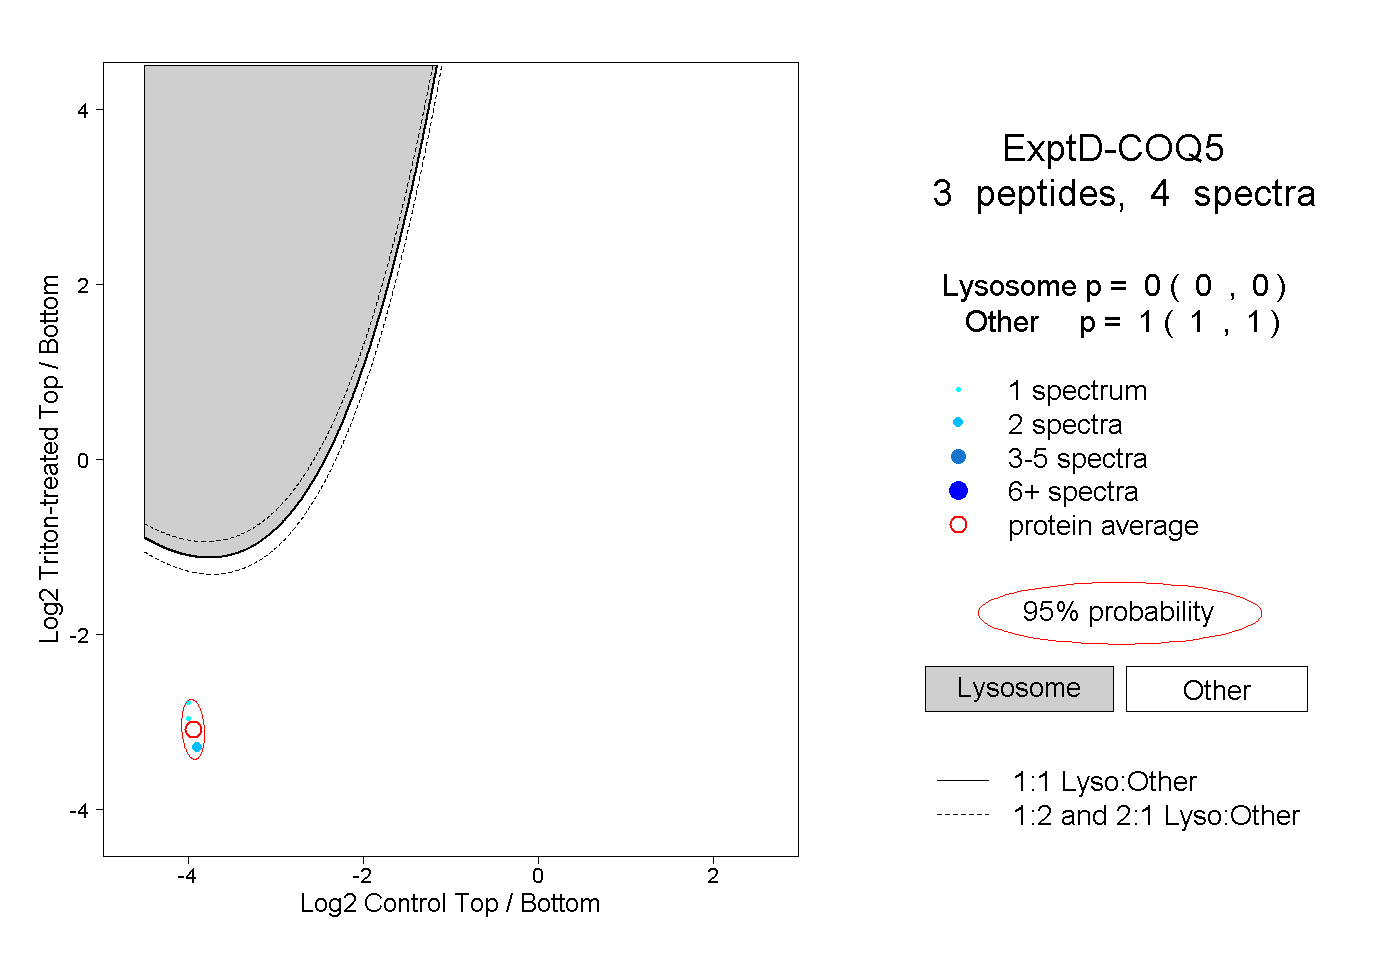
| Expt D |
3
peptides |
4
spectra |
 |
|
0.000
0.000 | 0.000 |
|
|
|
|
|
|
|
1.000
1.000 | 1.000 |