 7
7peptides
spectra
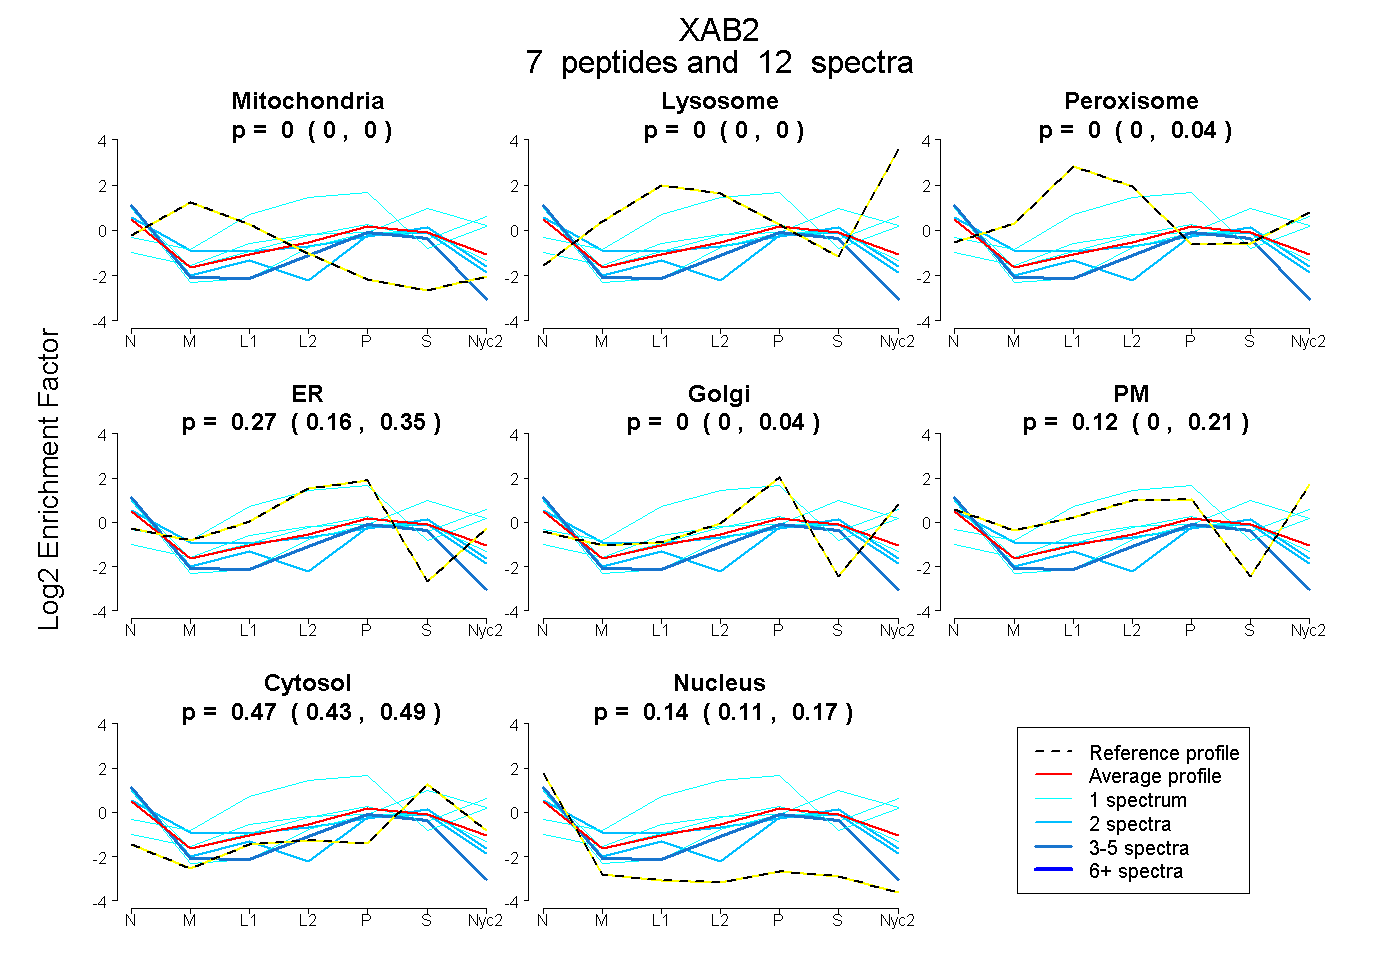
0.000 | 0.000
0.000 | 0.000
0.000 | 0.038
0.161 | 0.355
0.000 | 0.044
0.005 | 0.206
0.430 | 0.492
0.111 | 0.167
2peptides
spectra
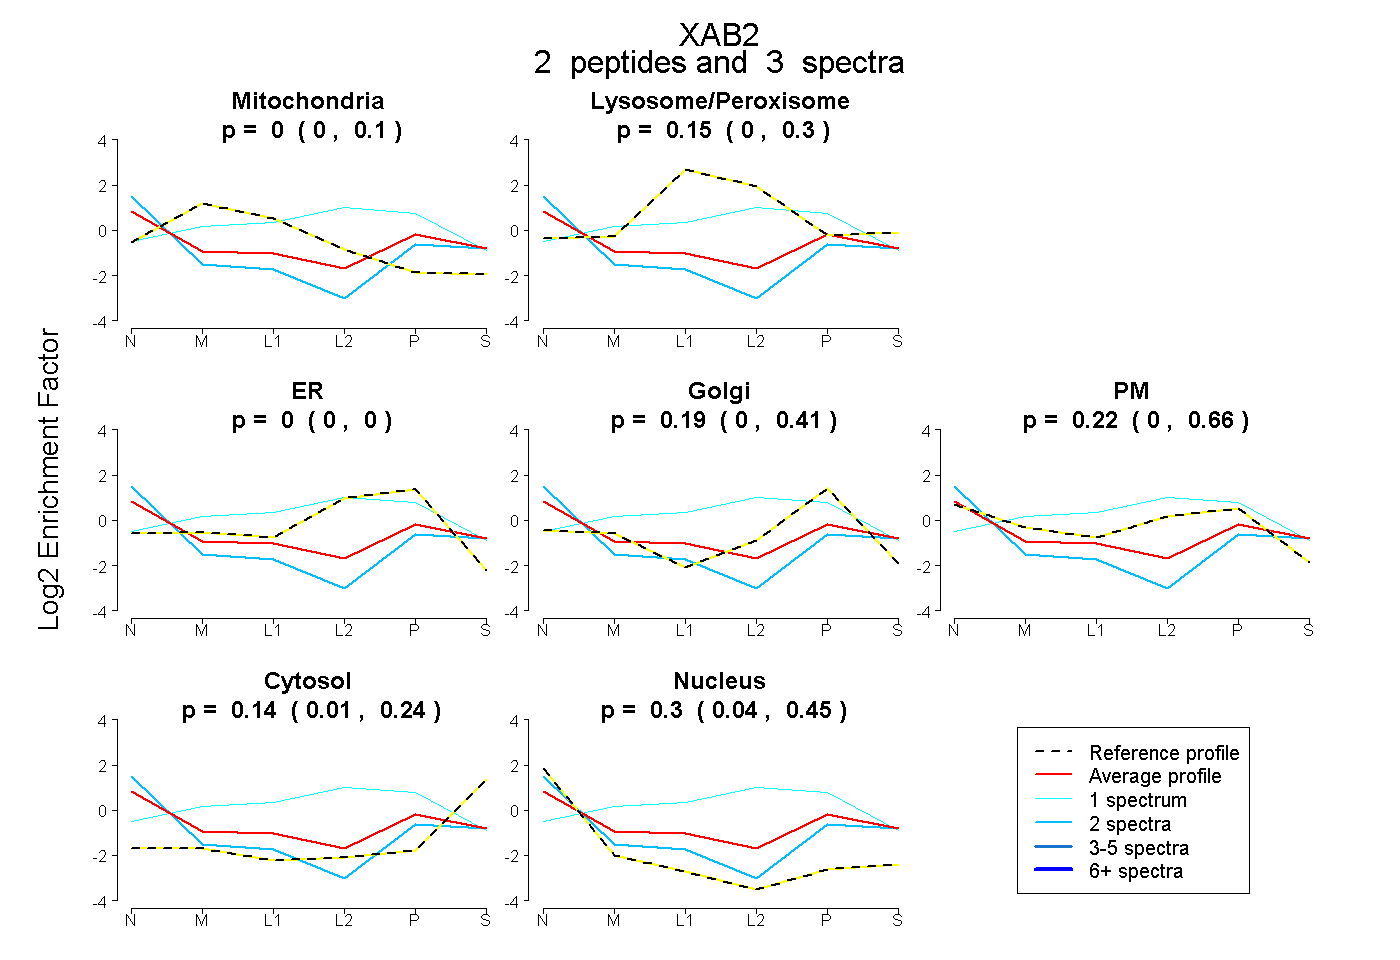
0.000 | 0.100
0.000 | 0.303
0.000 | 0.000
0.000 | 0.406
0.000 | 0.657
0.012 | 0.242
0.045 | 0.453
2peptides
spectra
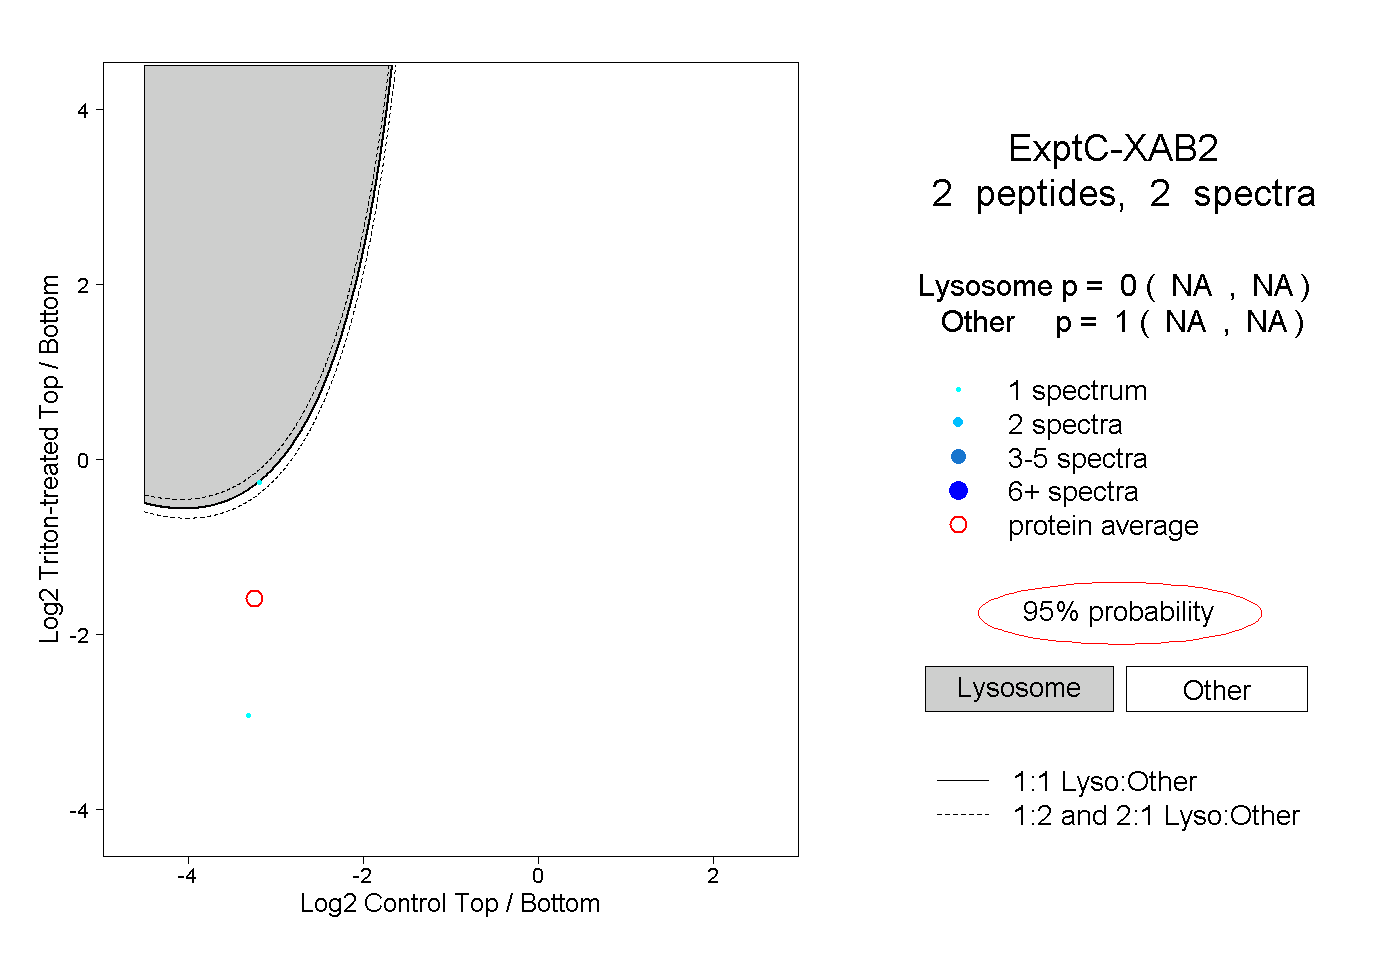
NA | NA
NA | NA