 7
7peptides
spectra
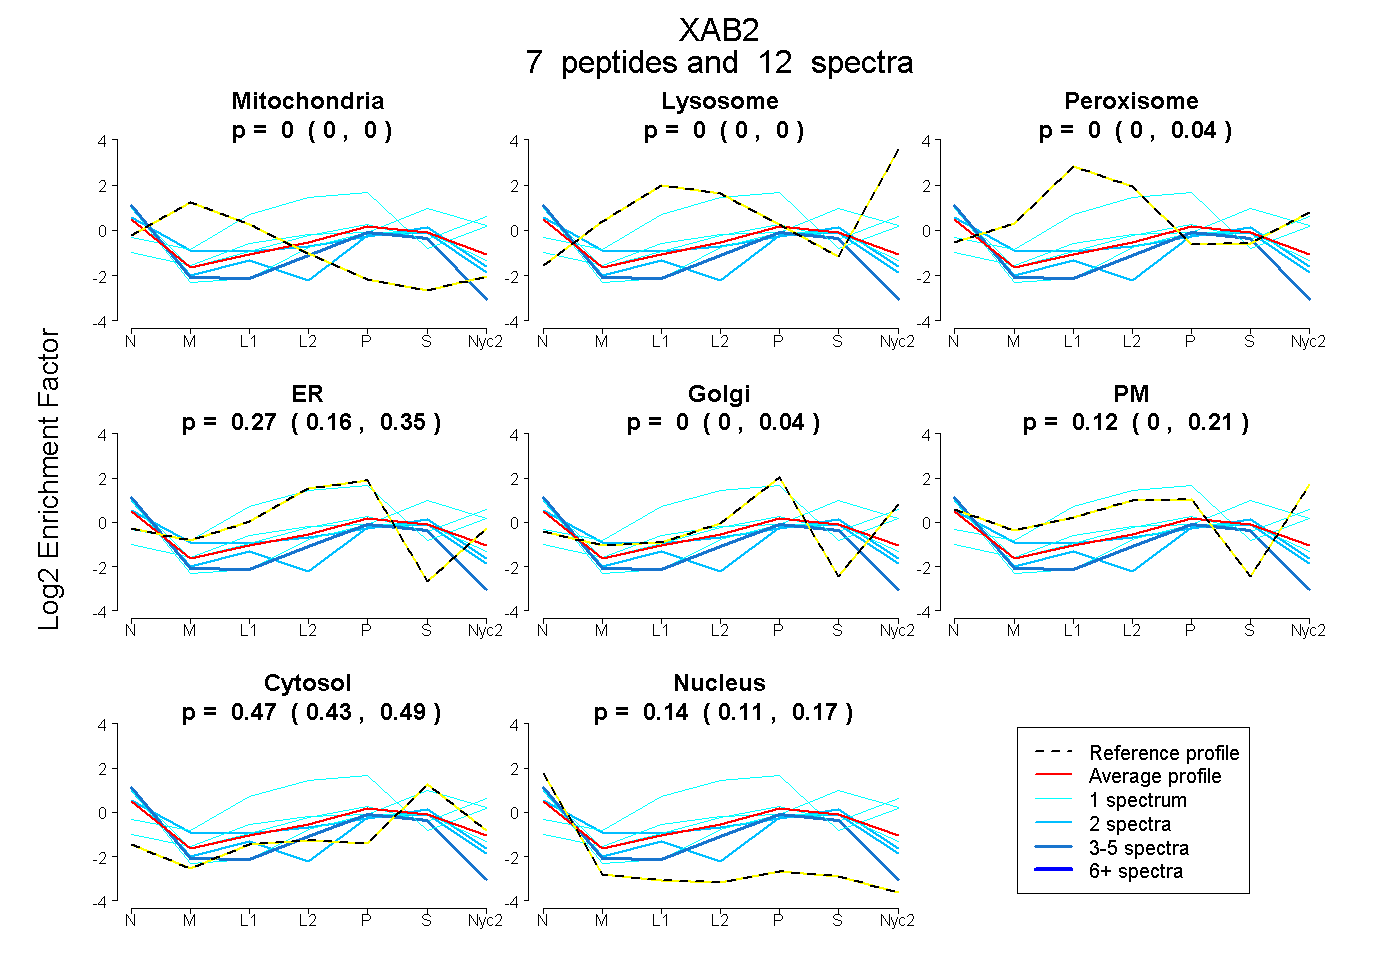
0.000 | 0.000
0.000 | 0.000
0.000 | 0.038
0.161 | 0.355
0.000 | 0.044
0.005 | 0.206
0.430 | 0.492
0.111 | 0.167
| Plot | Mito | Lyso | Perox | ER | Golgi | PM | Cytosol | Nucleus | |||||
| Expt A |
7 peptides |
12 spectra |
|
0.000 0.000 | 0.000 |
0.000 0.000 | 0.000 |
0.000 0.000 | 0.038 |
0.269 0.161 | 0.355 |
0.000 0.000 | 0.044 |
0.124 0.005 | 0.206 |
0.468 0.430 | 0.492 |
0.139 0.111 | 0.167 |
| 1 spectrum, IDEAAER | 0.000 | 0.152 | 0.082 | 0.022 | 0.104 | 0.000 | 0.641 | 0.000 | ||
| 2 spectra, DVYEEAIR | 0.000 | 0.000 | 0.030 | 0.000 | 0.202 | 0.000 | 0.415 | 0.353 | ||
| 2 spectra, AIEVLSDEHAR | 0.076 | 0.000 | 0.118 | 0.206 | 0.000 | 0.000 | 0.421 | 0.178 | ||
| 4 spectra, VALHQGRPR | 0.000 | 0.000 | 0.000 | 0.243 | 0.000 | 0.000 | 0.323 | 0.434 | ||
| 1 spectrum, HGNEDTIR | 0.000 | 0.000 | 0.000 | 0.138 | 0.118 | 0.040 | 0.439 | 0.265 | ||
| 1 spectrum, FEQLISR | 0.000 | 0.000 | 0.000 | 0.000 | 0.000 | 0.553 | 0.373 | 0.074 | ||
| 1 spectrum, VVMAR | 0.000 | 0.063 | 0.216 | 0.602 | 0.000 | 0.000 | 0.119 | 0.000 |
| Plot | Mito | Lyso or Perox | ER | Golgi | PM | Cytosol | Nucleus | ||||||
| Expt B |
2 peptides |
3 spectra |
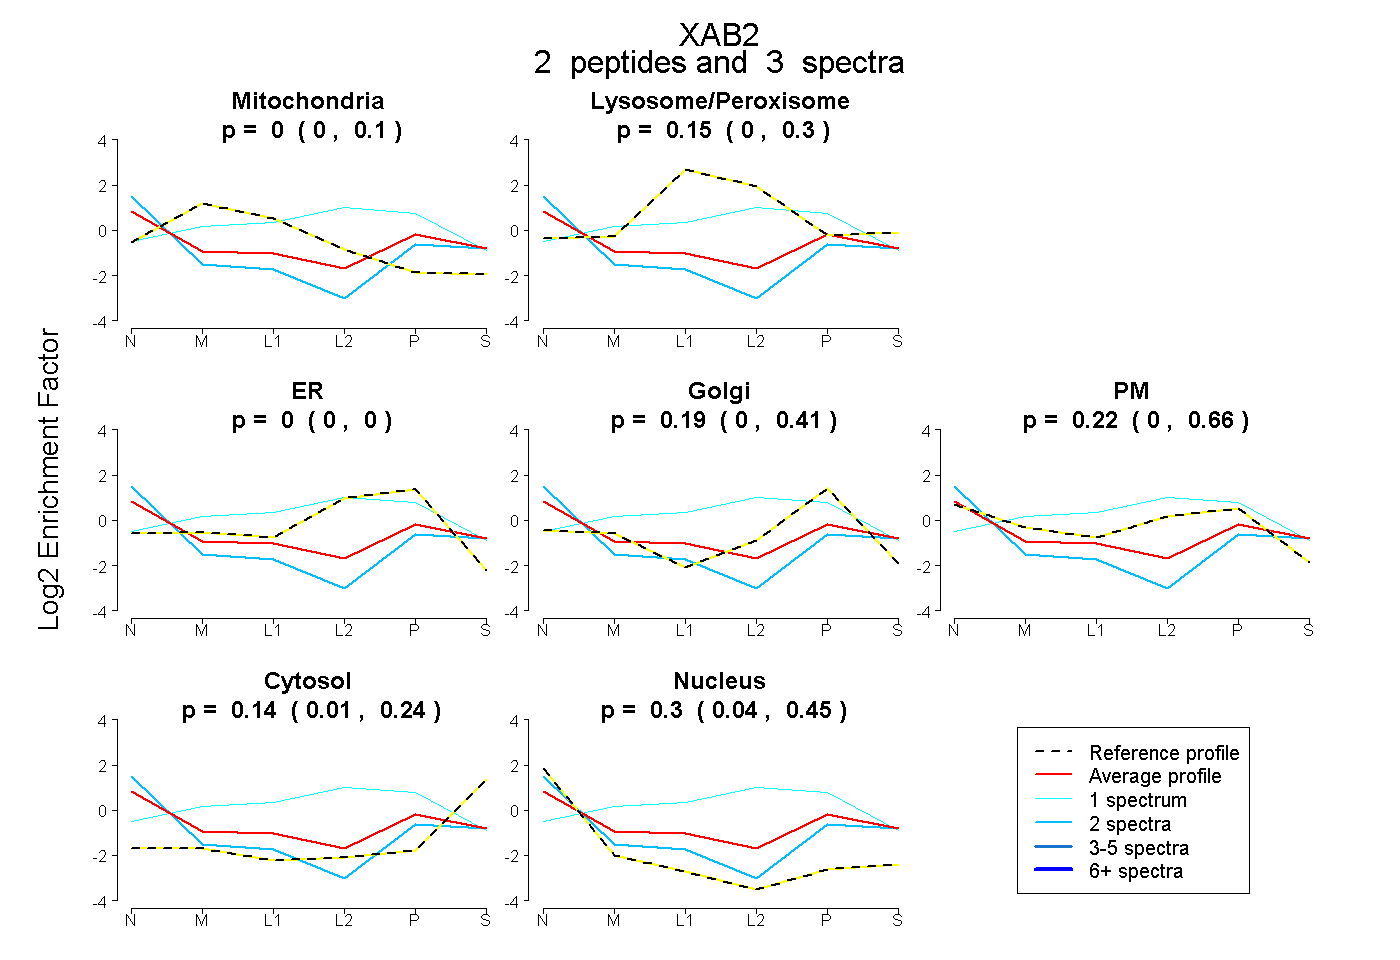 |
0.000 0.000 | 0.100 |
0.149 0.000 | 0.303 |
0.000 0.000 | 0.000 |
0.195 0.000 | 0.406 |
0.225 0.000 | 0.657 |
0.135 0.012 | 0.242 |
0.296 0.045 | 0.453 |
|||
| Plot | Lyso | Other | |||||||||||
| Expt C |
2 peptides |
2 spectra |
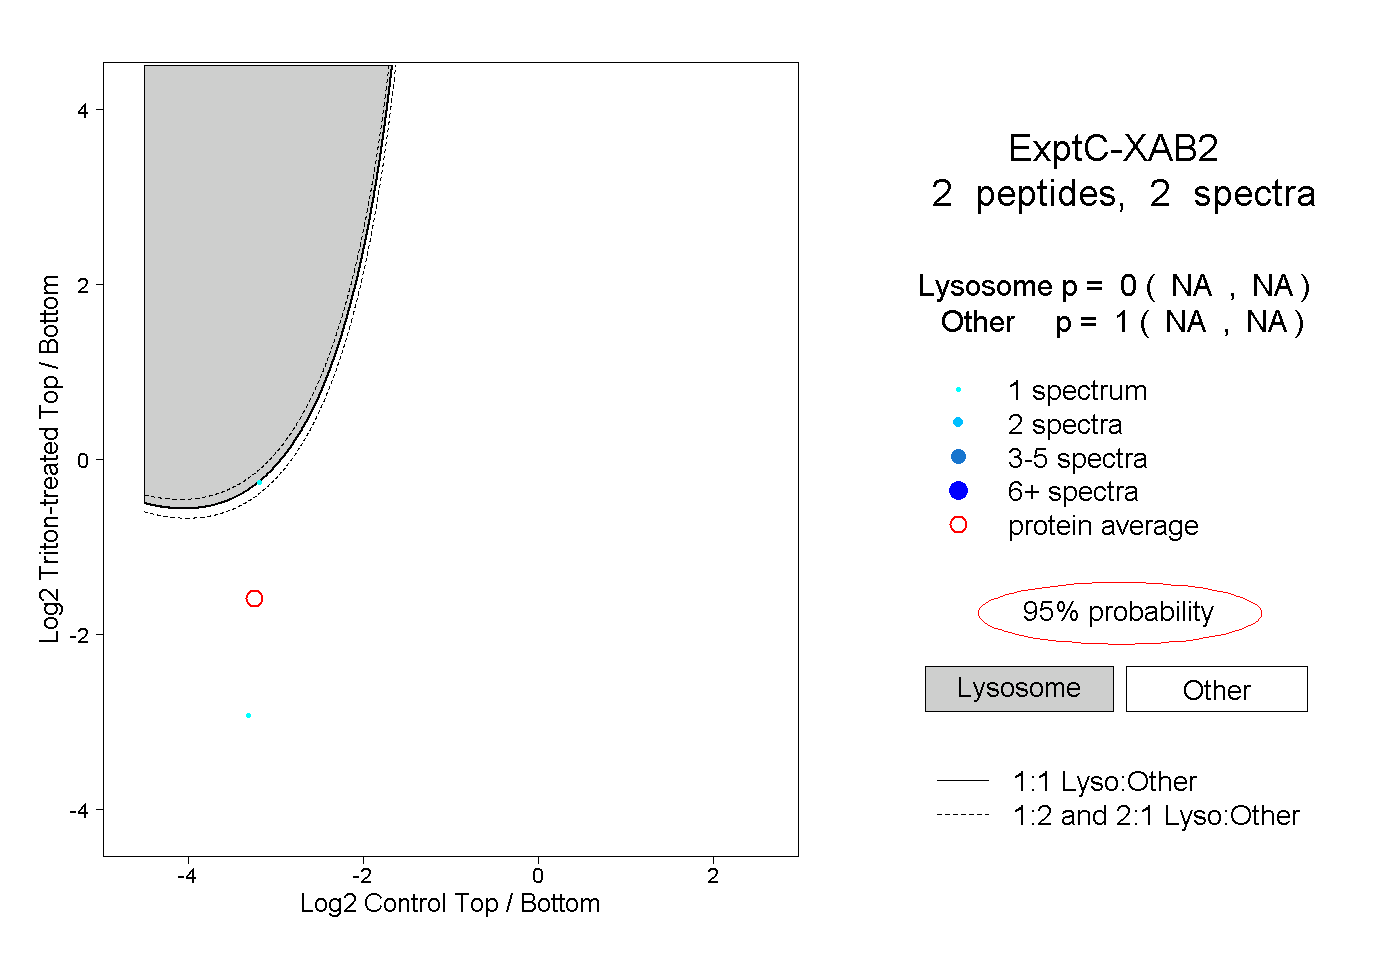 |
0.000 NA | NA |
1.000 NA | NA |