XAB2
[ENSRNOP00000001309]
Main page
| | | Plot |
Mito |
Lyso |
|
Perox |
ER |
Golgi |
PM |
Cytosol |
Nucleus |
|
| Expt A |
 7
7
peptides |
12
spectra |
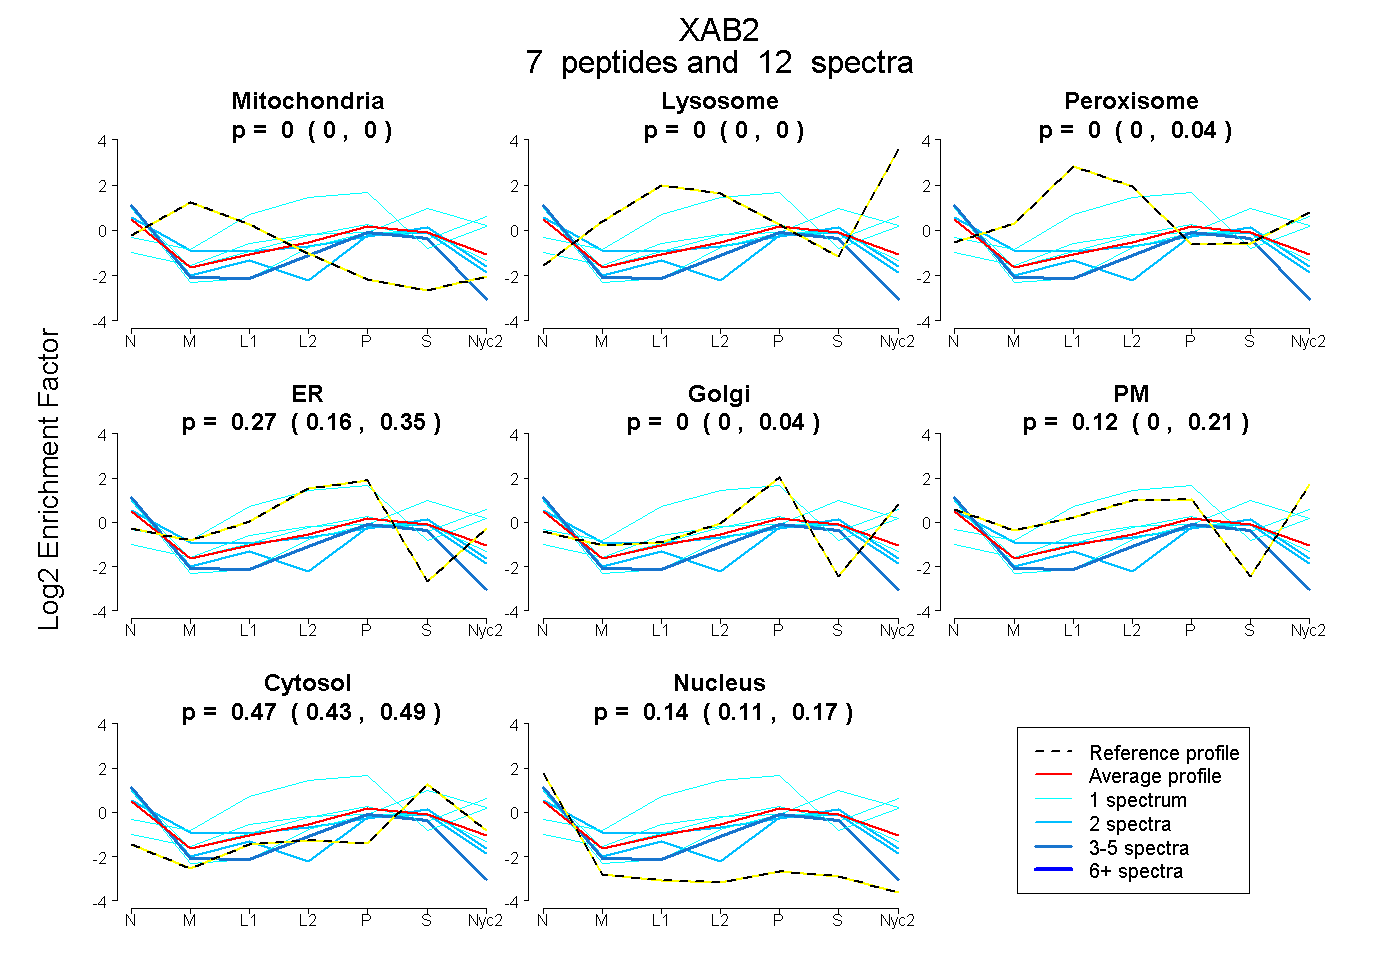 |
0.000
0.000 | 0.000 |
0.000
0.000 | 0.000 |
|
0.000
0.000 | 0.038 |
0.269
0.161 | 0.355 |
0.000
0.000 | 0.044 |
0.124
0.005 | 0.206 |
0.468
0.430 | 0.492 |
0.139
0.111 | 0.167 |
|
| | | Plot |
Mito |
|
Lyso or Perox |
|
ER |
Golgi |
PM |
Cytosol |
Nucleus |
|
| Expt B |
2
peptides |
3
spectra |
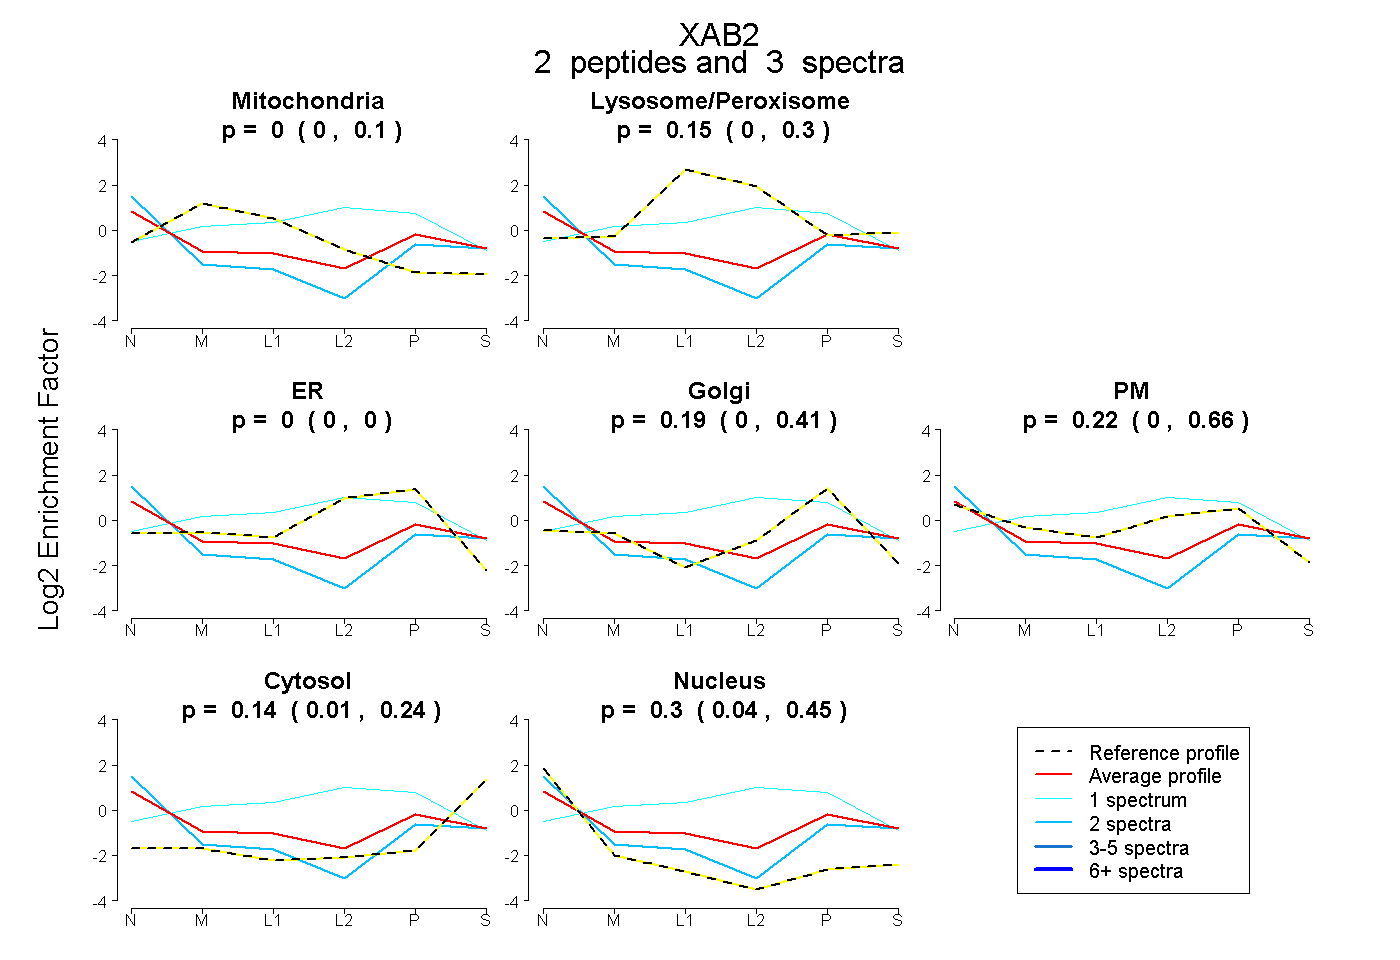 |
0.000
0.000 | 0.100 |
|
0.149
0.000 | 0.303 |
|
0.000
0.000 | 0.000 |
0.195
0.000 | 0.406 |
0.225
0.000 | 0.657 |
0.135
0.012 | 0.242 |
0.296
0.045 | 0.453 |
|
| 2 spectra, VALHQGRPR |
0.000 |
|
0.071 |
|
0.000 |
0.210 |
0.020 |
0.139 |
0.560 |
|
| 1 spectrum, VVMAR |
0.024 |
|
0.460 |
|
0.243 |
0.273 |
0.000 |
0.000 |
0.000 |
|
| | | Plot |
|
Lyso |
|
|
|
|
|
|
|
Other |
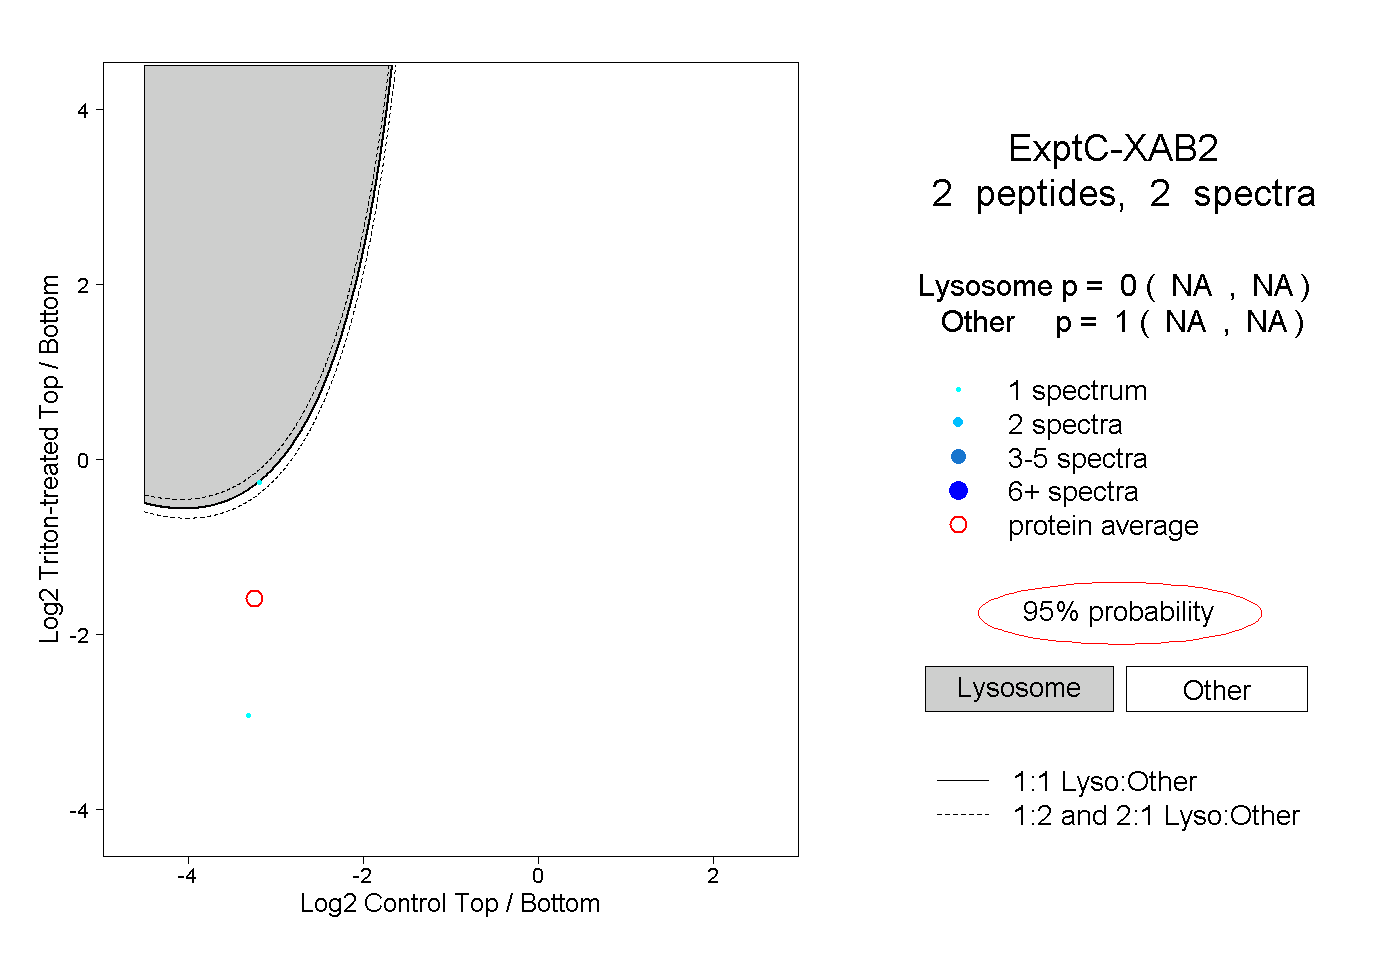
| Expt C |
2
peptides |
2
spectra |
 |
|
0.000
NA | NA |
|
|
|
|
|
|
|
1.000
NA | NA |