 20
20peptides
spectra
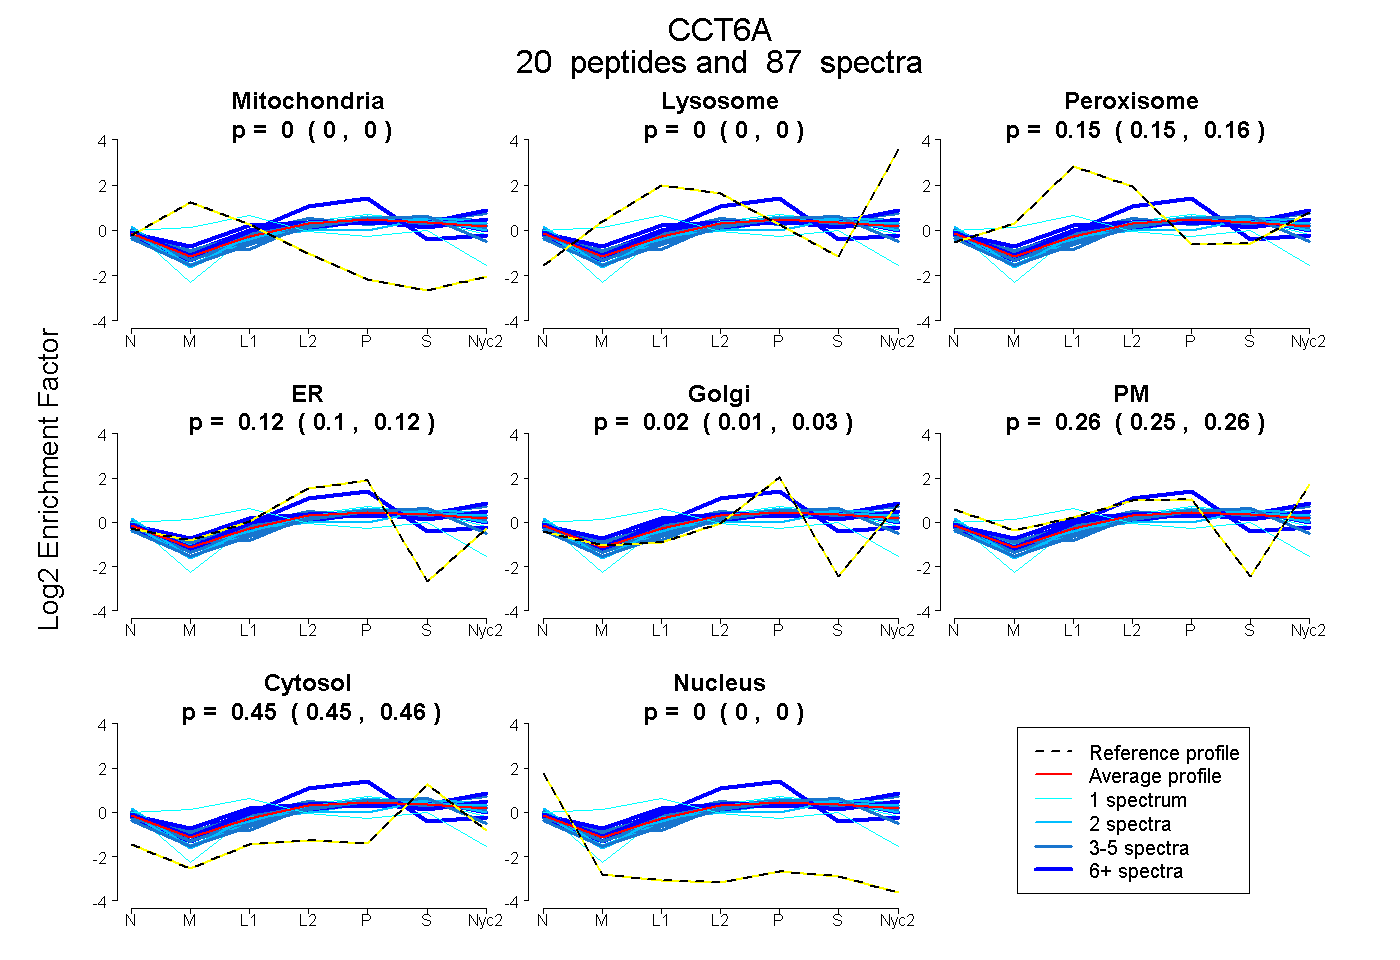
0.000 | 0.000
0.000 | 0.000
0.147 | 0.156
0.105 | 0.125
0.011 | 0.033
0.246 | 0.263
0.451 | 0.457
0.000 | 0.000
12peptides
spectra
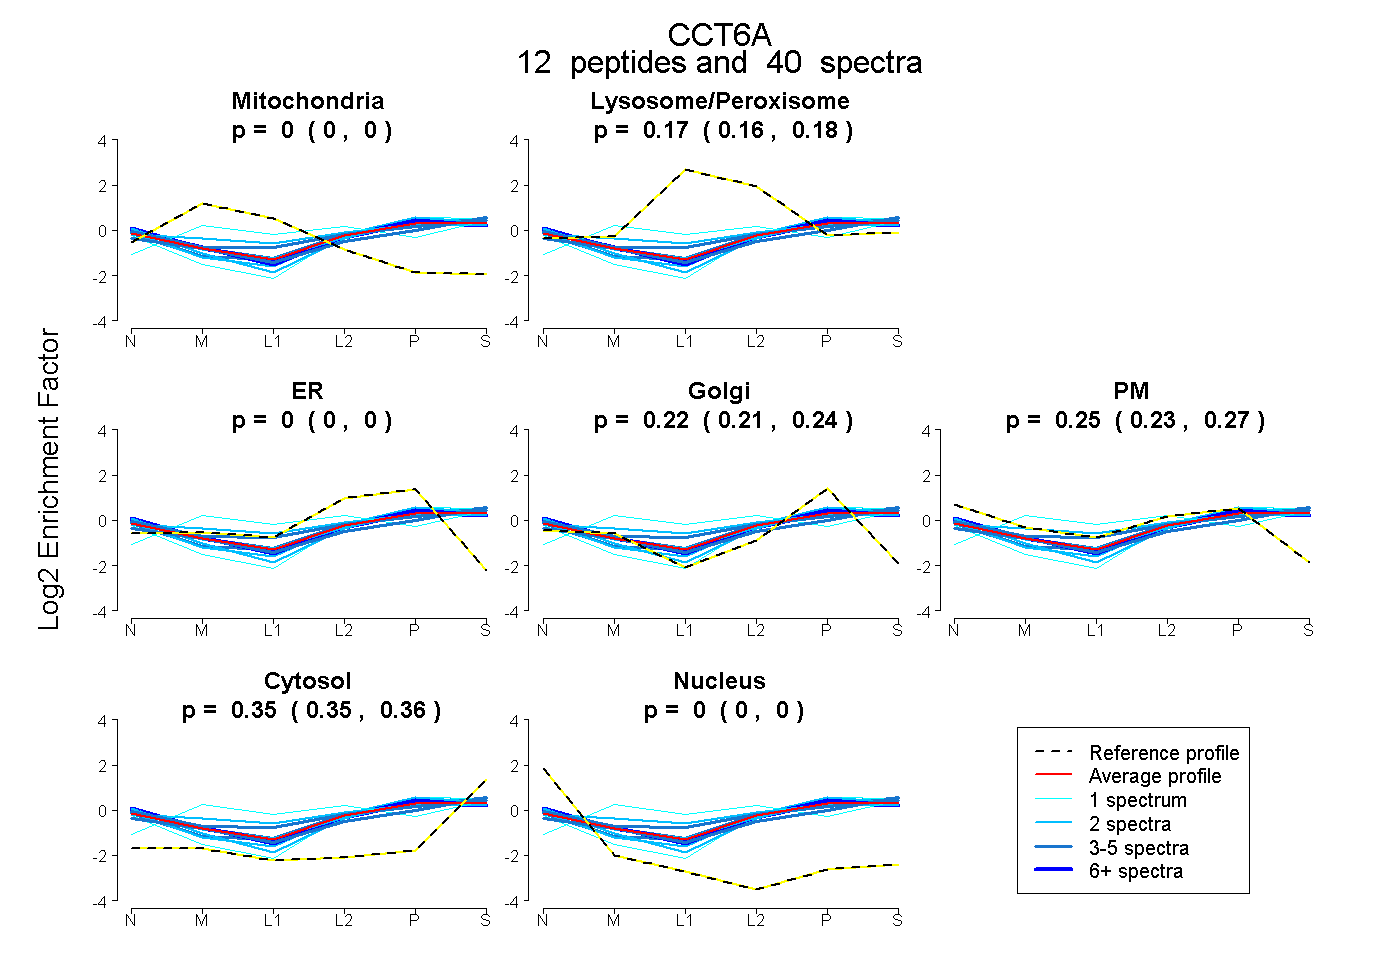
0.000 | 0.000
0.163 | 0.177
0.000 | 0.000
0.211 | 0.236
0.234 | 0.266
0.349 | 0.356
0.000 | 0.000
20peptides
spectra
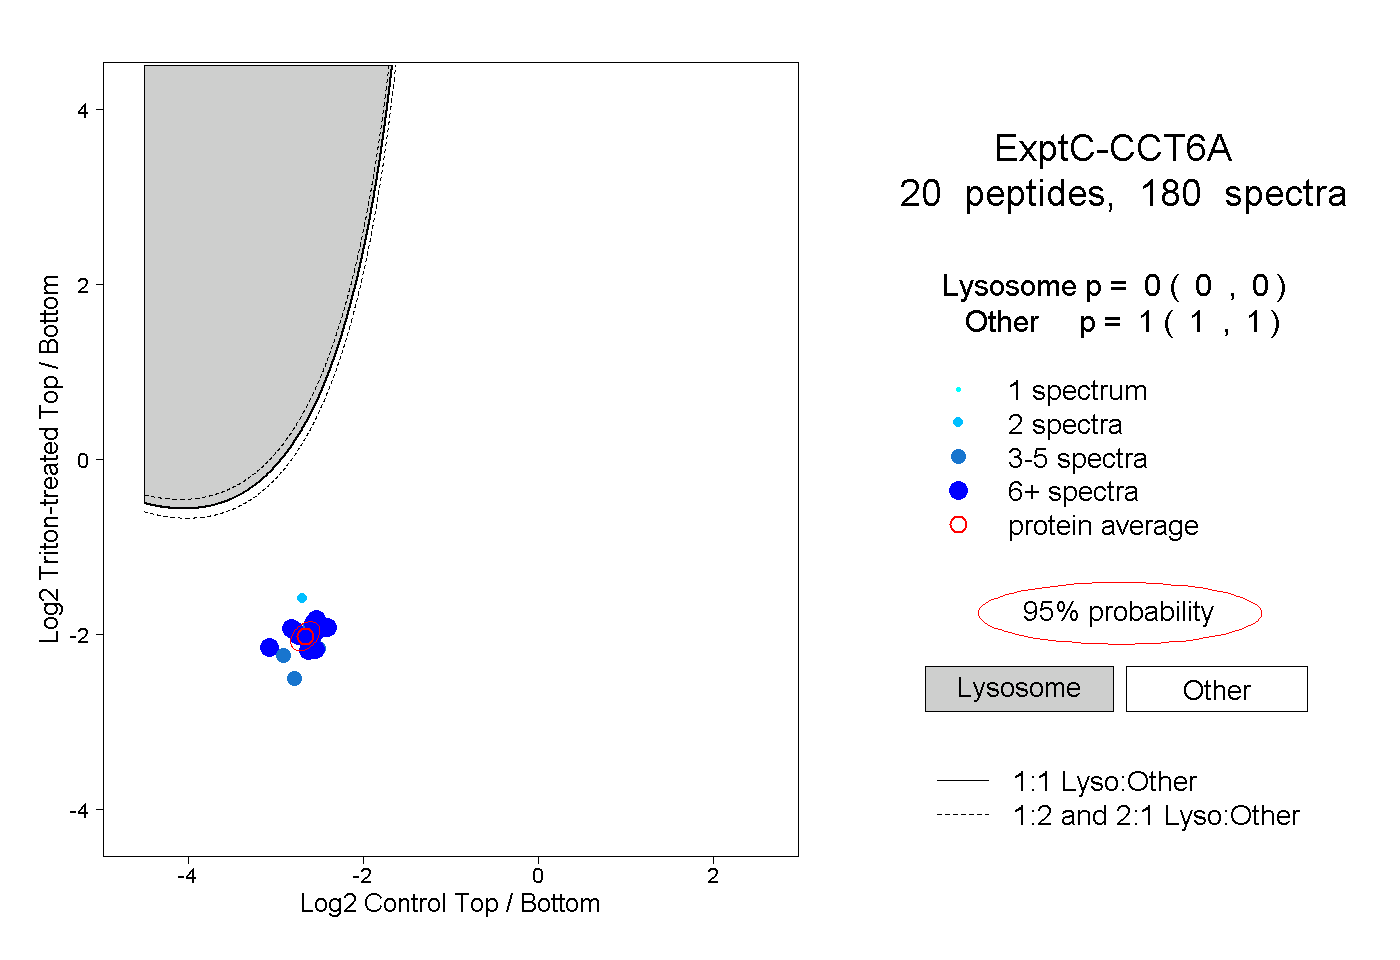
0.000 | 0.000
1.000 | 1.000
11peptides
spectra
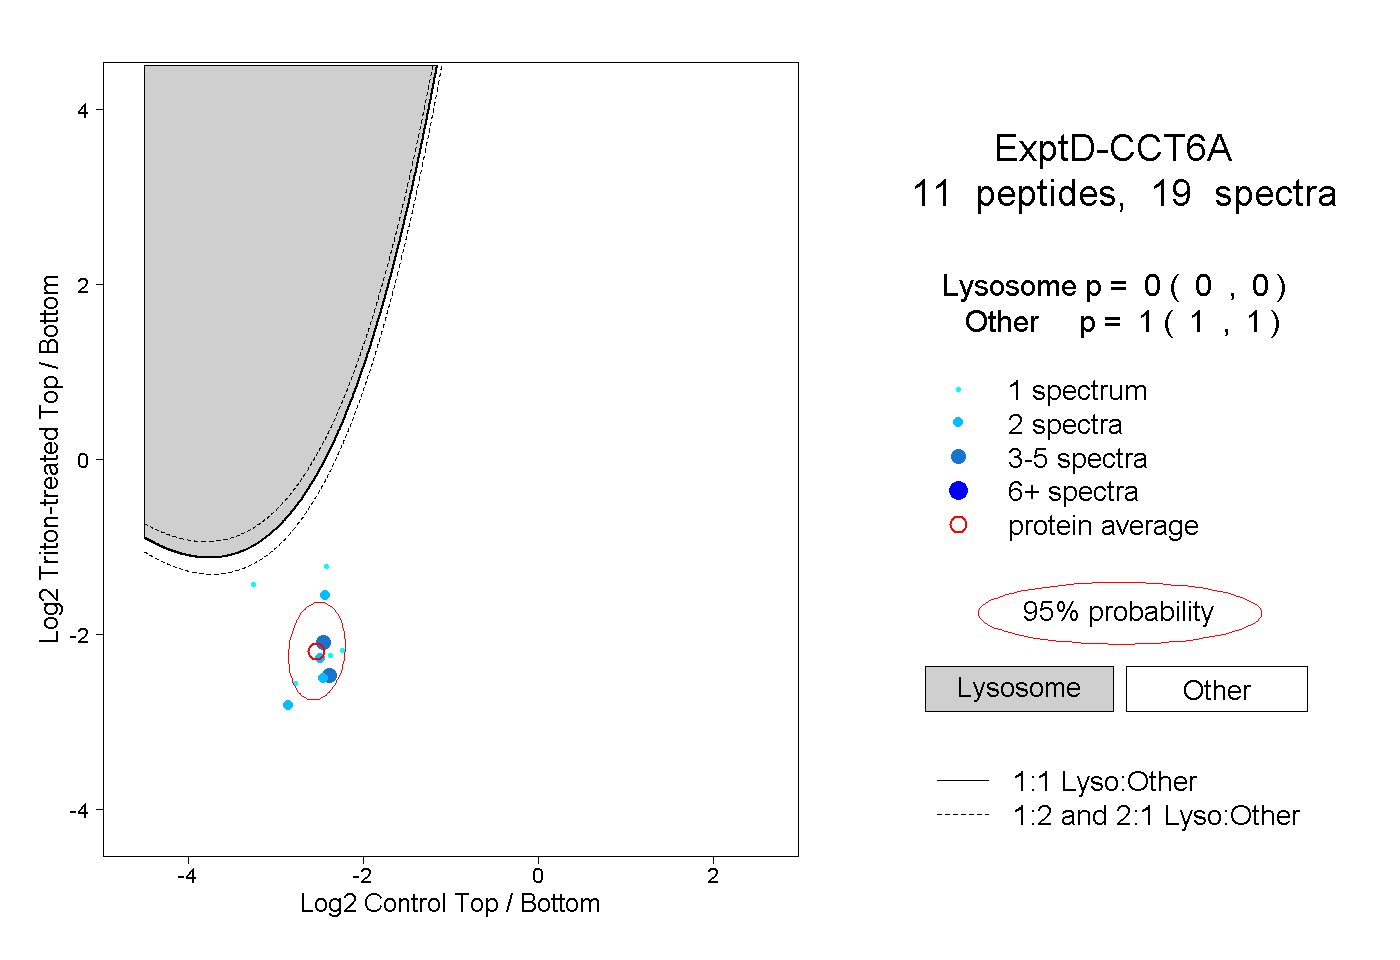
0.000 | 0.000
1.000 | 1.000