 20
20peptides
spectra
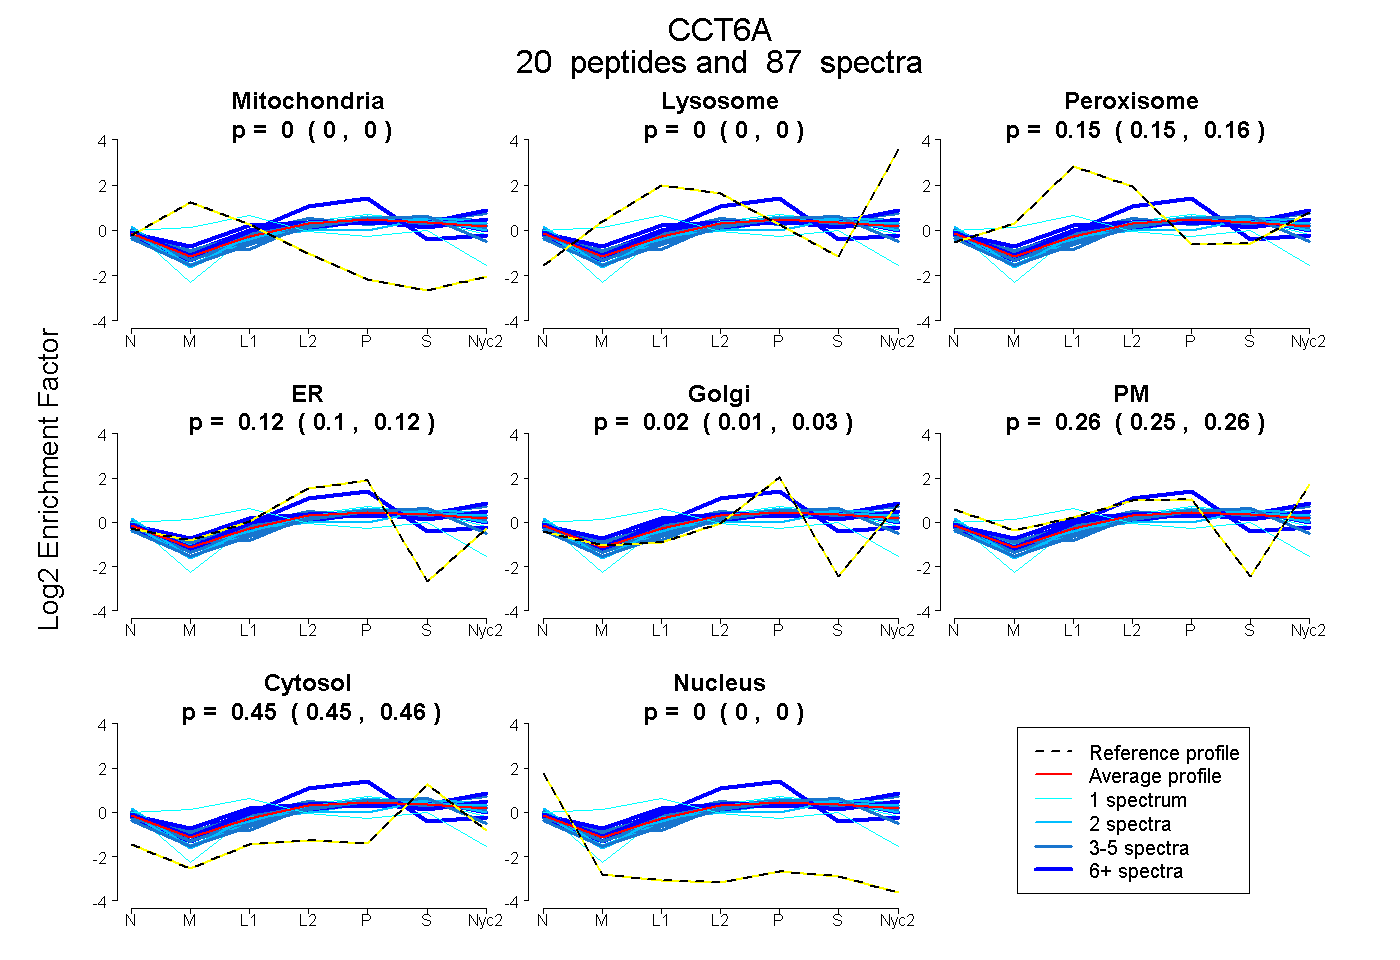
0.000 | 0.000
0.000 | 0.000
0.147 | 0.156
0.105 | 0.125
0.011 | 0.033
0.246 | 0.263
0.451 | 0.457
0.000 | 0.000
| Plot | Mito | Lyso | Perox | ER | Golgi | PM | Cytosol | Nucleus | |||||
| Expt A |
20 peptides |
87 spectra |
|
0.000 0.000 | 0.000 |
0.000 0.000 | 0.000 |
0.152 0.147 | 0.156 |
0.116 0.105 | 0.125 |
0.023 0.011 | 0.033 |
0.255 0.246 | 0.263 |
0.454 0.451 | 0.457 |
0.000 0.000 | 0.000 |
| 2 spectra, SVTLLVK | 0.000 | 0.000 | 0.139 | 0.054 | 0.046 | 0.309 | 0.452 | 0.000 | ||
| 2 spectra, AGMSSLK | 0.000 | 0.000 | 0.255 | 0.000 | 0.265 | 0.042 | 0.438 | 0.000 | ||
| 4 spectra, VCGDSDK | 0.000 | 0.000 | 0.080 | 0.336 | 0.000 | 0.020 | 0.564 | 0.000 | ||
| 12 spectra, TNLGPK | 0.000 | 0.000 | 0.130 | 0.594 | 0.000 | 0.004 | 0.272 | 0.000 | ||
| 1 spectrum, VENAYILTCNVSLEYEK | 0.301 | 0.000 | 0.280 | 0.121 | 0.000 | 0.000 | 0.297 | 0.000 | ||
| 2 spectra, TEVNSGFFYK | 0.000 | 0.000 | 0.137 | 0.004 | 0.000 | 0.310 | 0.548 | 0.000 | ||
| 2 spectra, EGIVALR | 0.000 | 0.032 | 0.061 | 0.074 | 0.000 | 0.326 | 0.507 | 0.000 | ||
| 4 spectra, GLQDVLR | 0.000 | 0.000 | 0.112 | 0.173 | 0.000 | 0.225 | 0.490 | 0.000 | ||
| 1 spectrum, AQLGVQAFADALLIIPK | 0.000 | 0.000 | 0.076 | 0.313 | 0.000 | 0.100 | 0.512 | 0.000 | ||
| 2 spectra, HPDMK | 0.000 | 0.014 | 0.075 | 0.044 | 0.000 | 0.360 | 0.507 | 0.000 | ||
| 5 spectra, FTLIEK | 0.000 | 0.011 | 0.074 | 0.029 | 0.000 | 0.387 | 0.499 | 0.000 | ||
| 3 spectra, IITEGFEAAK | 0.000 | 0.000 | 0.054 | 0.092 | 0.000 | 0.368 | 0.487 | 0.000 | ||
| 8 spectra, GLVLDHGAR | 0.000 | 0.104 | 0.140 | 0.000 | 0.000 | 0.336 | 0.420 | 0.000 | ||
| 4 spectra, GFVVINQK | 0.000 | 0.024 | 0.170 | 0.000 | 0.000 | 0.375 | 0.431 | 0.000 | ||
| 8 spectra, GIDPFSLDALAK | 0.000 | 0.000 | 0.179 | 0.098 | 0.096 | 0.135 | 0.492 | 0.000 | ||
| 4 spectra, ALQFLEQVK | 0.000 | 0.000 | 0.137 | 0.100 | 0.000 | 0.299 | 0.464 | 0.000 | ||
| 5 spectra, HTLTQIK | 0.000 | 0.000 | 0.100 | 0.071 | 0.023 | 0.353 | 0.453 | 0.000 | ||
| 12 spectra, QADLYISEGLHPR | 0.000 | 0.000 | 0.295 | 0.000 | 0.127 | 0.231 | 0.347 | 0.000 | ||
| 2 spectra, AQAALAVNISAAR | 0.000 | 0.000 | 0.065 | 0.196 | 0.000 | 0.241 | 0.499 | 0.000 | ||
| 4 spectra, MLVSGAGDIK | 0.000 | 0.000 | 0.248 | 0.019 | 0.238 | 0.112 | 0.383 | 0.000 |
| Plot | Mito | Lyso or Perox | ER | Golgi | PM | Cytosol | Nucleus | ||||||
| Expt B |
12 peptides |
40 spectra |
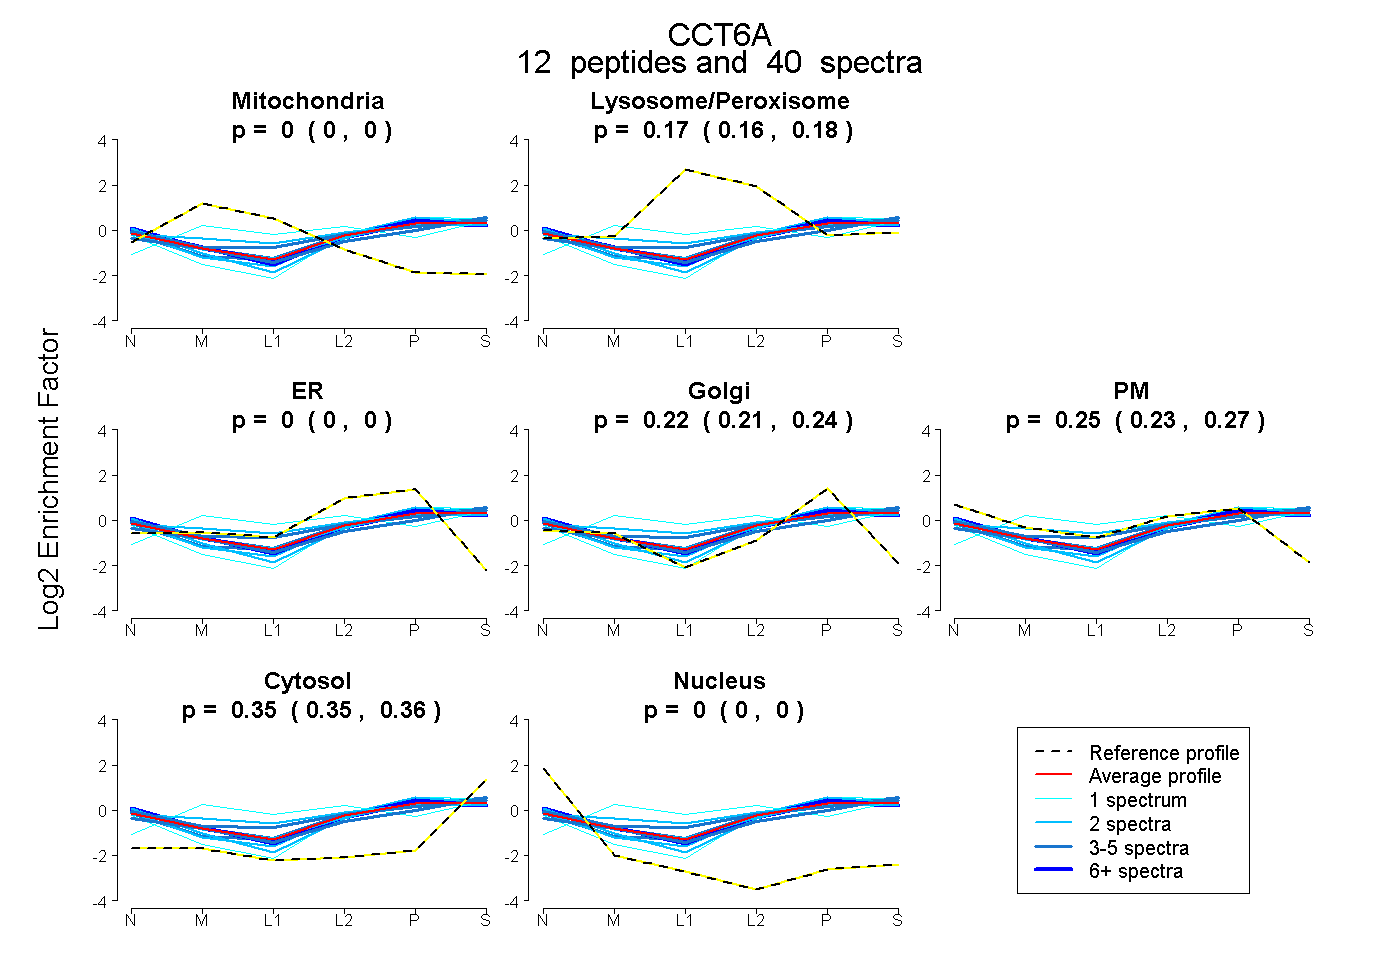 |
0.000 0.000 | 0.000 |
0.171 0.163 | 0.177 |
0.000 0.000 | 0.000 |
0.224 0.211 | 0.236 |
0.252 0.234 | 0.266 |
0.352 0.349 | 0.356 |
0.000 0.000 | 0.000 |
|||
| Plot | Lyso | Other | |||||||||||
| Expt C |
20 peptides |
180 spectra |
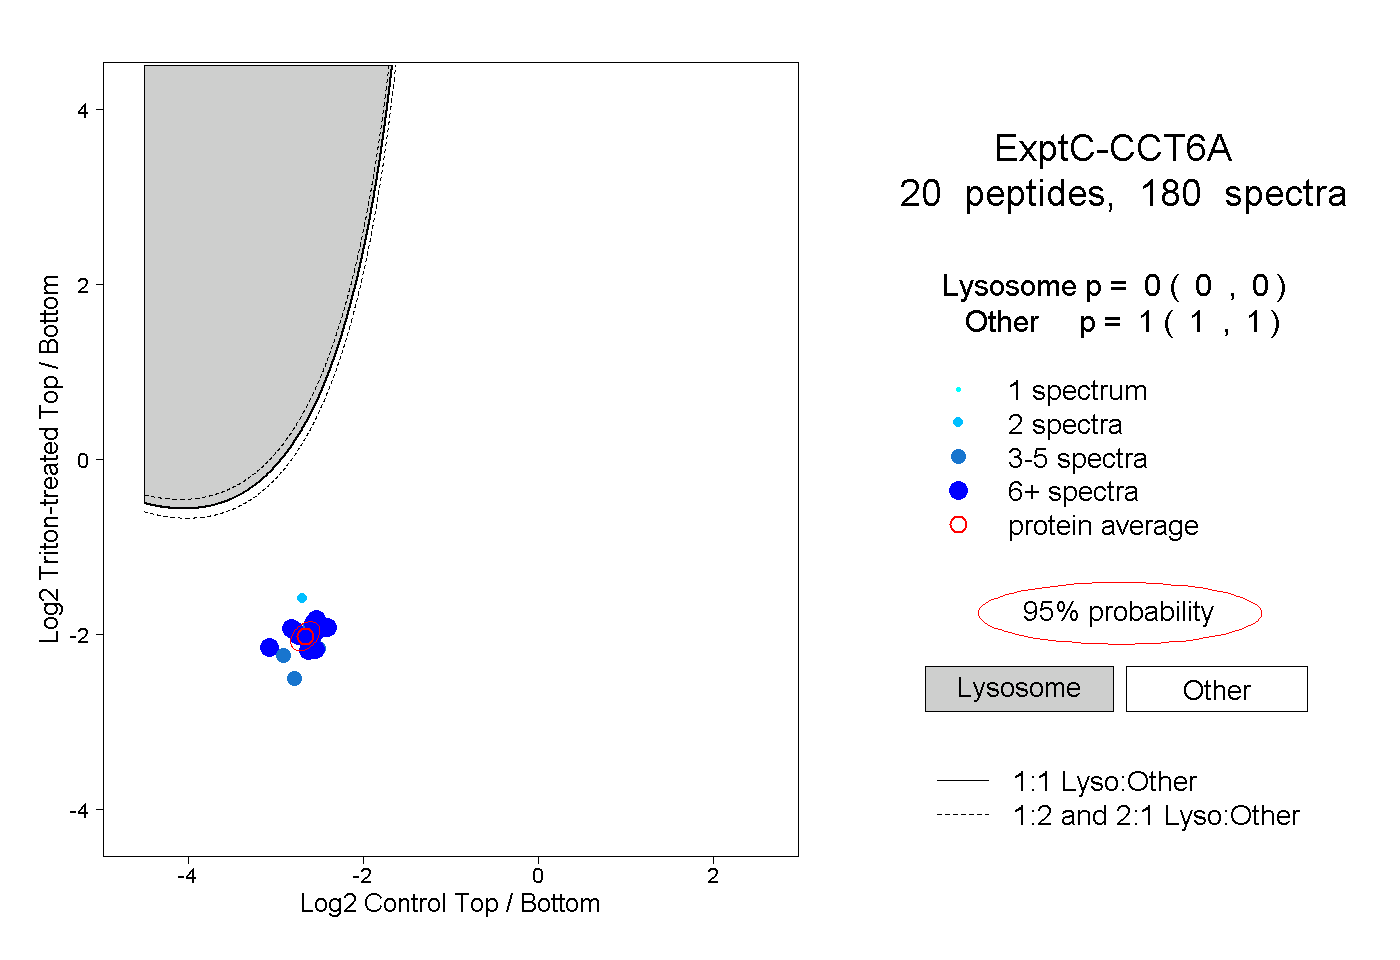 |
0.000 0.000 | 0.000 |
1.000 1.000 | 1.000 |
||||||||
| Plot | Lyso | Other | |||||||||||
| Expt D |
11 peptides |
19 spectra |
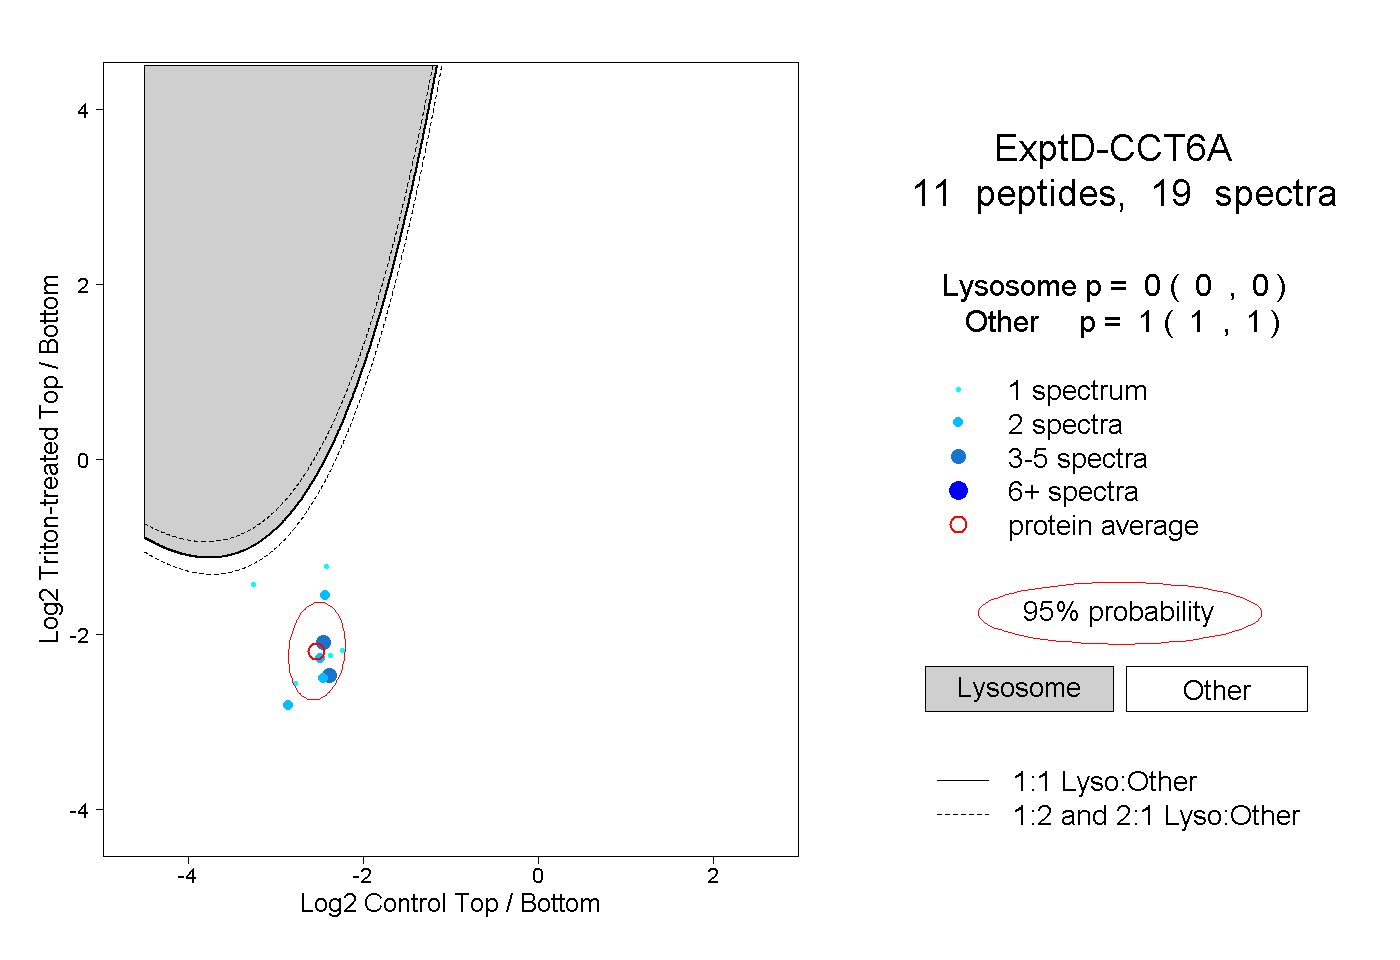 |
0.000 0.000 | 0.000 |
1.000 1.000 | 1.000 |