CCT6A
[ENSRNOP00000001227]
Main page
| | | Plot |
Mito |
Lyso |
|
Perox |
ER |
Golgi |
PM |
Cytosol |
Nucleus |
|
| Expt A |
 20
20
peptides |
87
spectra |
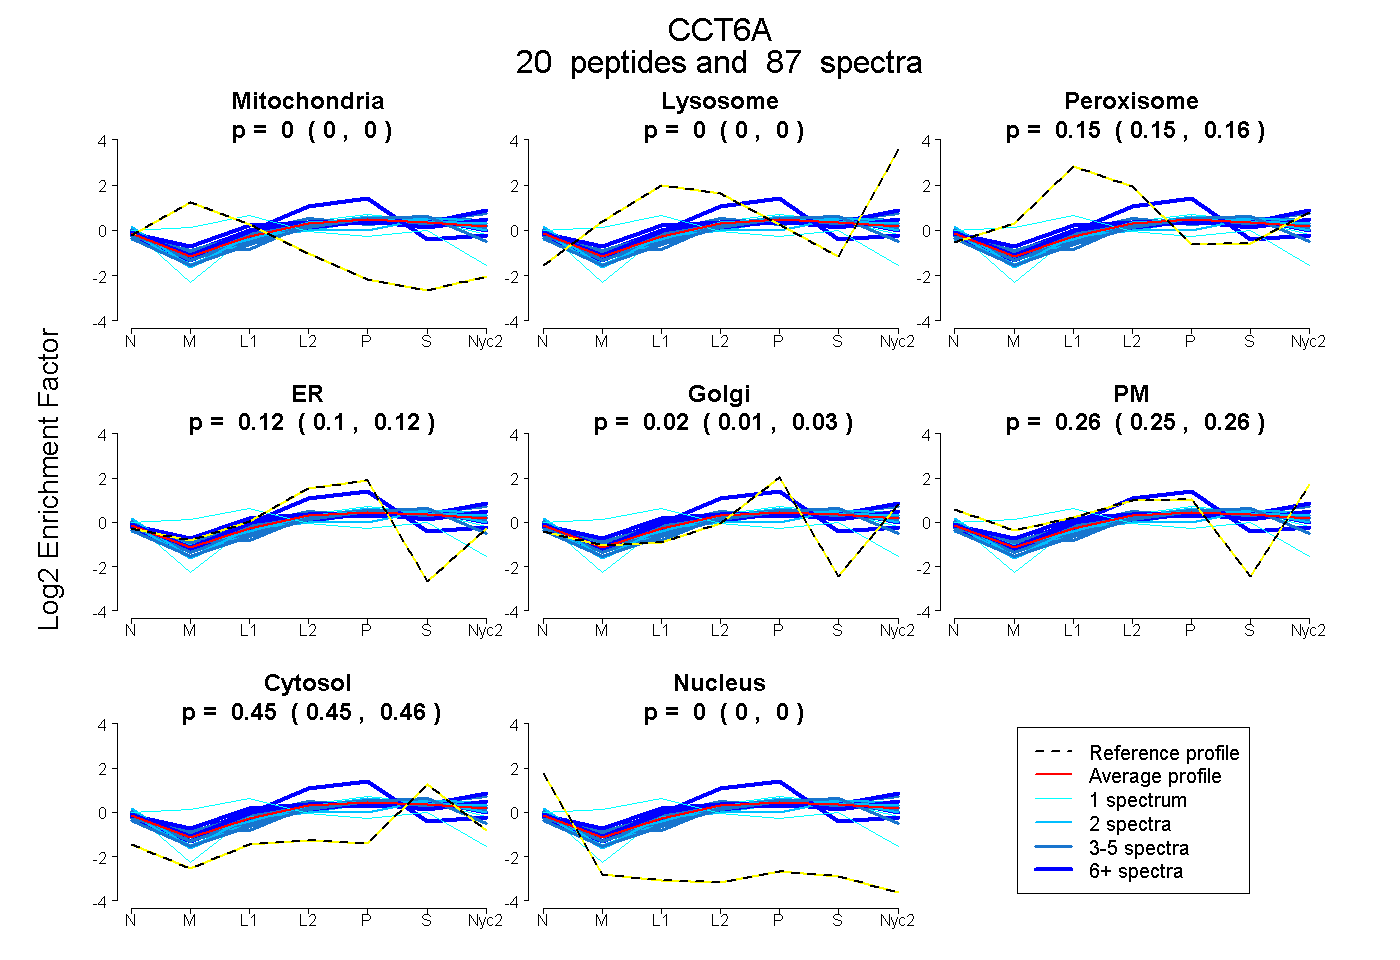 |
0.000
0.000 | 0.000 |
0.000
0.000 | 0.000 |
|
0.152
0.147 | 0.156 |
0.116
0.105 | 0.125 |
0.023
0.011 | 0.033 |
0.255
0.246 | 0.263 |
0.454
0.451 | 0.457 |
0.000
0.000 | 0.000 |
|
| | | Plot |
Mito |
|
Lyso or Perox |
|
ER |
Golgi |
PM |
Cytosol |
Nucleus |
|
| Expt B |
12
peptides |
40
spectra |
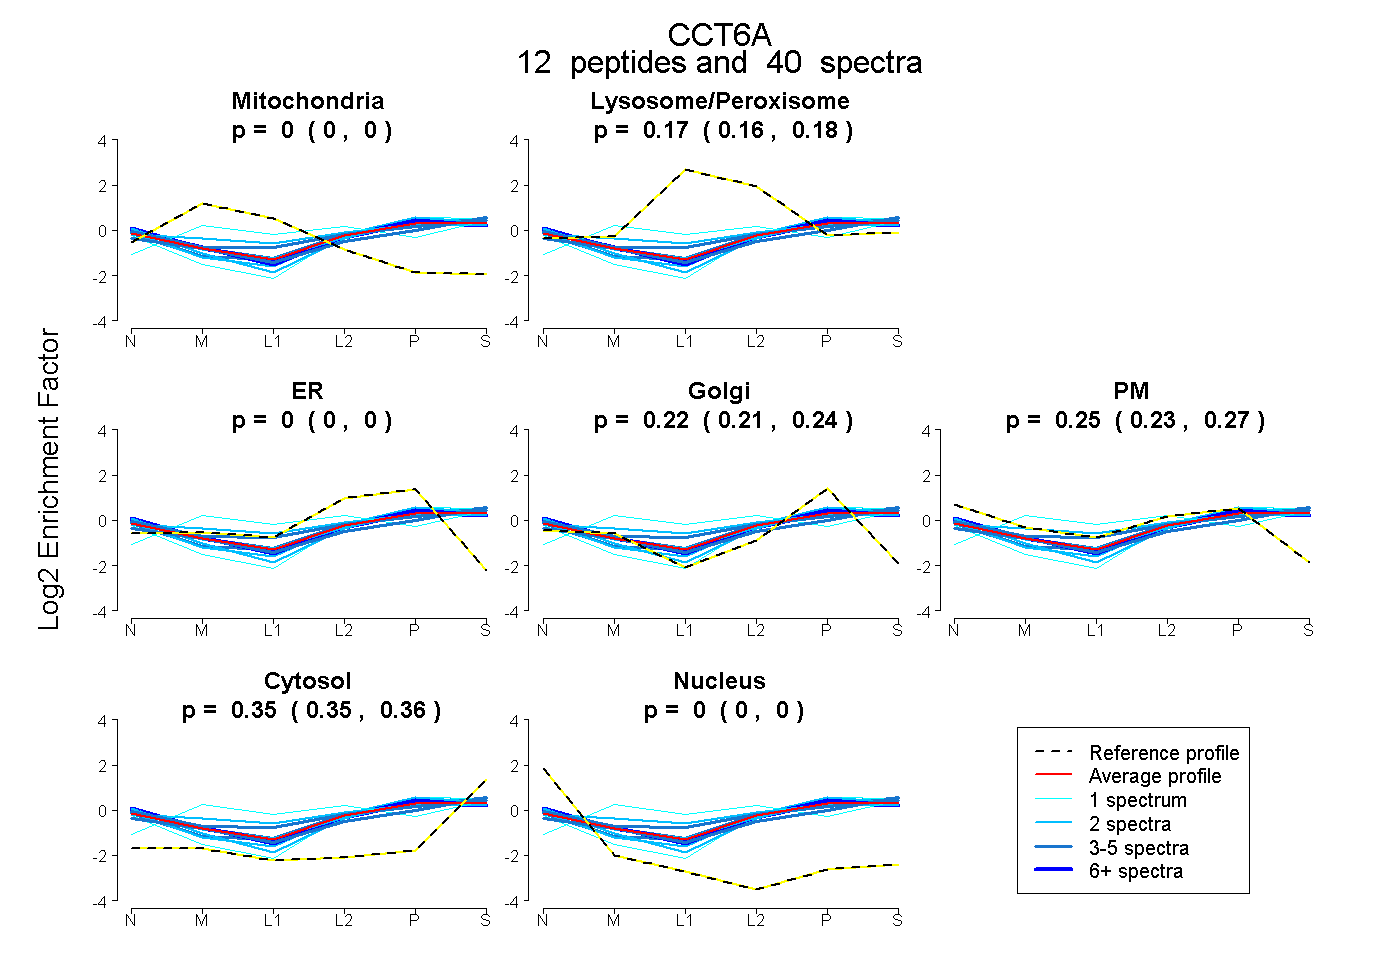 |
0.000
0.000 | 0.000 |
|
0.171
0.163 | 0.177 |
|
0.000
0.000 | 0.000 |
0.224
0.211 | 0.236 |
0.252
0.234 | 0.266 |
0.352
0.349 | 0.356 |
0.000
0.000 | 0.000 |
|
| 1 spectrum, IVELK |
0.074 |
|
0.429 |
|
0.000 |
0.177 |
0.000 |
0.320 |
0.000 |
|
| 1 spectrum, ETLIDVAR |
0.000 |
|
0.000 |
|
0.283 |
0.132 |
0.124 |
0.460 |
0.000 |
|
| 3 spectra, TEVNSGFFYK |
0.000 |
|
0.156 |
|
0.000 |
0.187 |
0.211 |
0.446 |
0.000 |
|
| 6 spectra, GIDPFSLDALAK |
0.000 |
|
0.111 |
|
0.000 |
0.135 |
0.413 |
0.341 |
0.000 |
|
| 3 spectra, EGIVALR |
0.000 |
|
0.192 |
|
0.000 |
0.250 |
0.179 |
0.379 |
0.000 |
|
| 2 spectra, HTLTQIK |
0.000 |
|
0.301 |
|
0.000 |
0.208 |
0.211 |
0.280 |
0.000 |
|
| 2 spectra, GLQDVLR |
0.000 |
|
0.036 |
|
0.000 |
0.224 |
0.388 |
0.352 |
0.000 |
|
| 5 spectra, ALQFLEQVK |
0.000 |
|
0.179 |
|
0.000 |
0.244 |
0.256 |
0.321 |
0.000 |
|
| 3 spectra, QADLYISEGLHPR |
0.000 |
|
0.243 |
|
0.000 |
0.100 |
0.307 |
0.350 |
0.000 |
|
| 2 spectra, IITEGFEAAK |
0.000 |
|
0.138 |
|
0.000 |
0.148 |
0.360 |
0.354 |
0.000 |
|
| 10 spectra, GLVLDHGAR |
0.000 |
|
0.110 |
|
0.000 |
0.212 |
0.348 |
0.330 |
0.000 |
|
| 2 spectra, GFVVINQK |
0.000 |
|
0.135 |
|
0.025 |
0.289 |
0.204 |
0.347 |
0.000 |
|
| | | Plot |
|
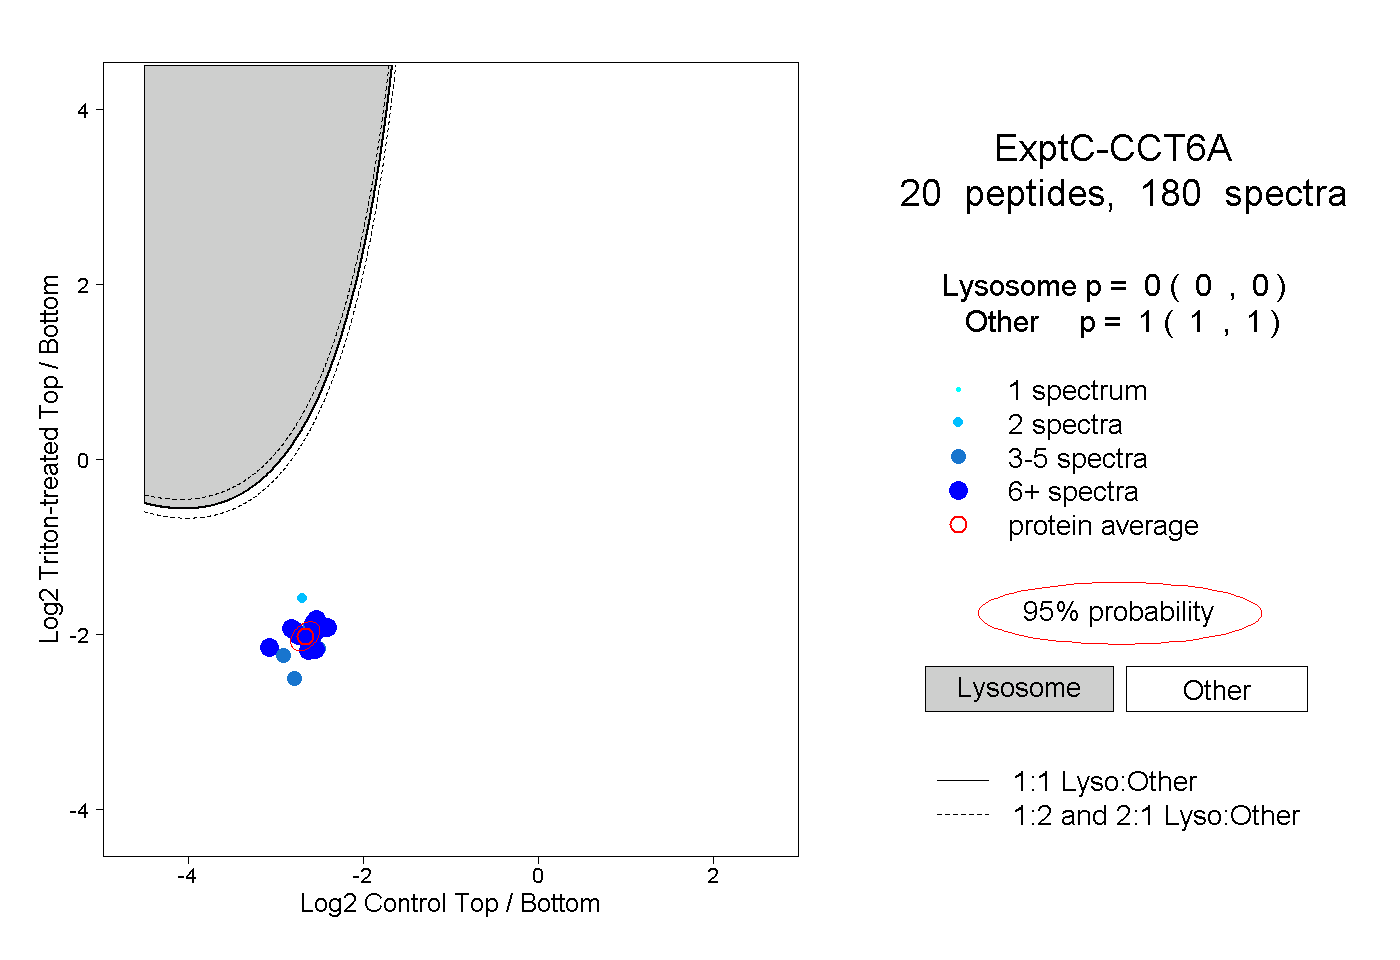
Lyso |
|
|
|
|
|
|
|
Other |
| Expt C |
20
peptides |
180
spectra |
 |
|
0.000
0.000 | 0.000 |
|
|
|
|
|
|
|
1.000
1.000 | 1.000 |
| | | Plot |
|
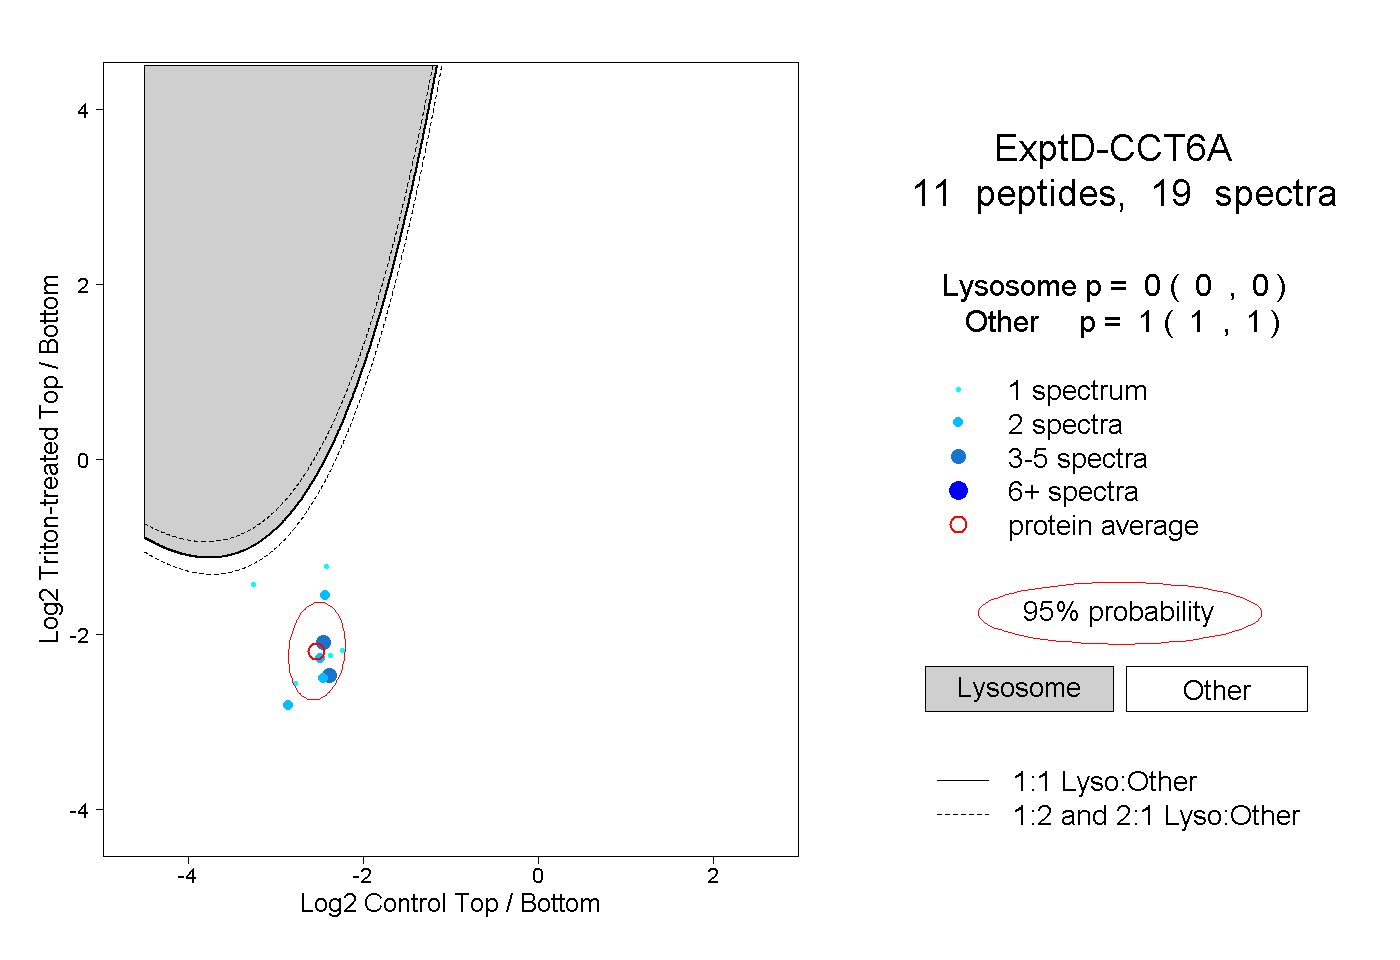
Lyso |
|
|
|
|
|
|
|
Other |
| Expt D |
11
peptides |
19
spectra |
 |
|
0.000
0.000 | 0.000 |
|
|
|
|
|
|
|
1.000
1.000 | 1.000 |