 12
12peptides
spectra
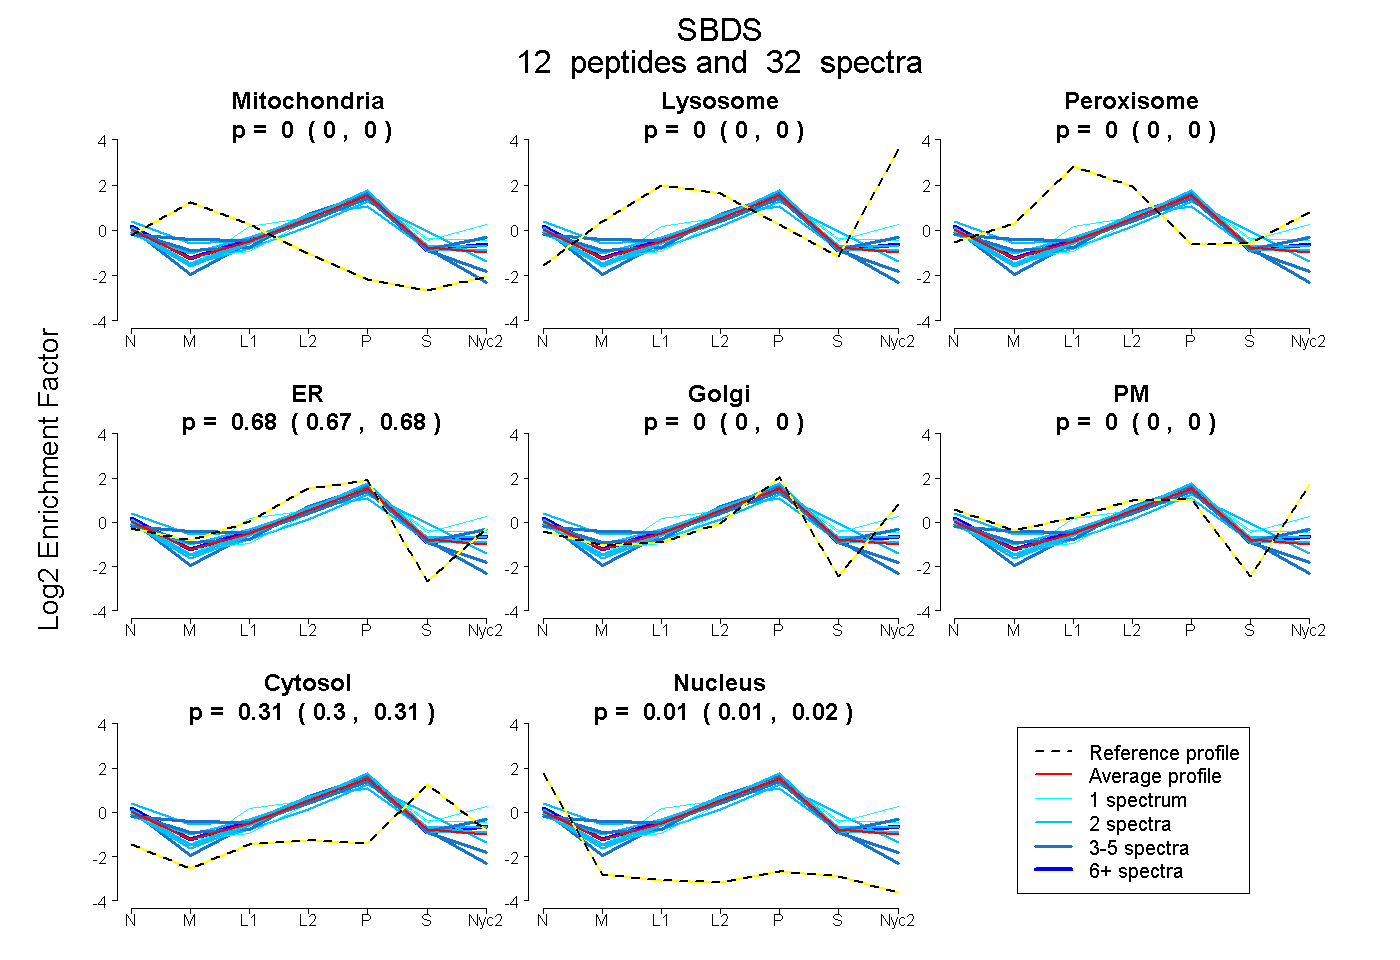
0.000 | 0.000
0.000 | 0.000
0.000 | 0.000
0.674 | 0.682
0.000 | 0.000
0.000 | 0.000
0.304 | 0.315
0.006 | 0.017
5peptides
spectra
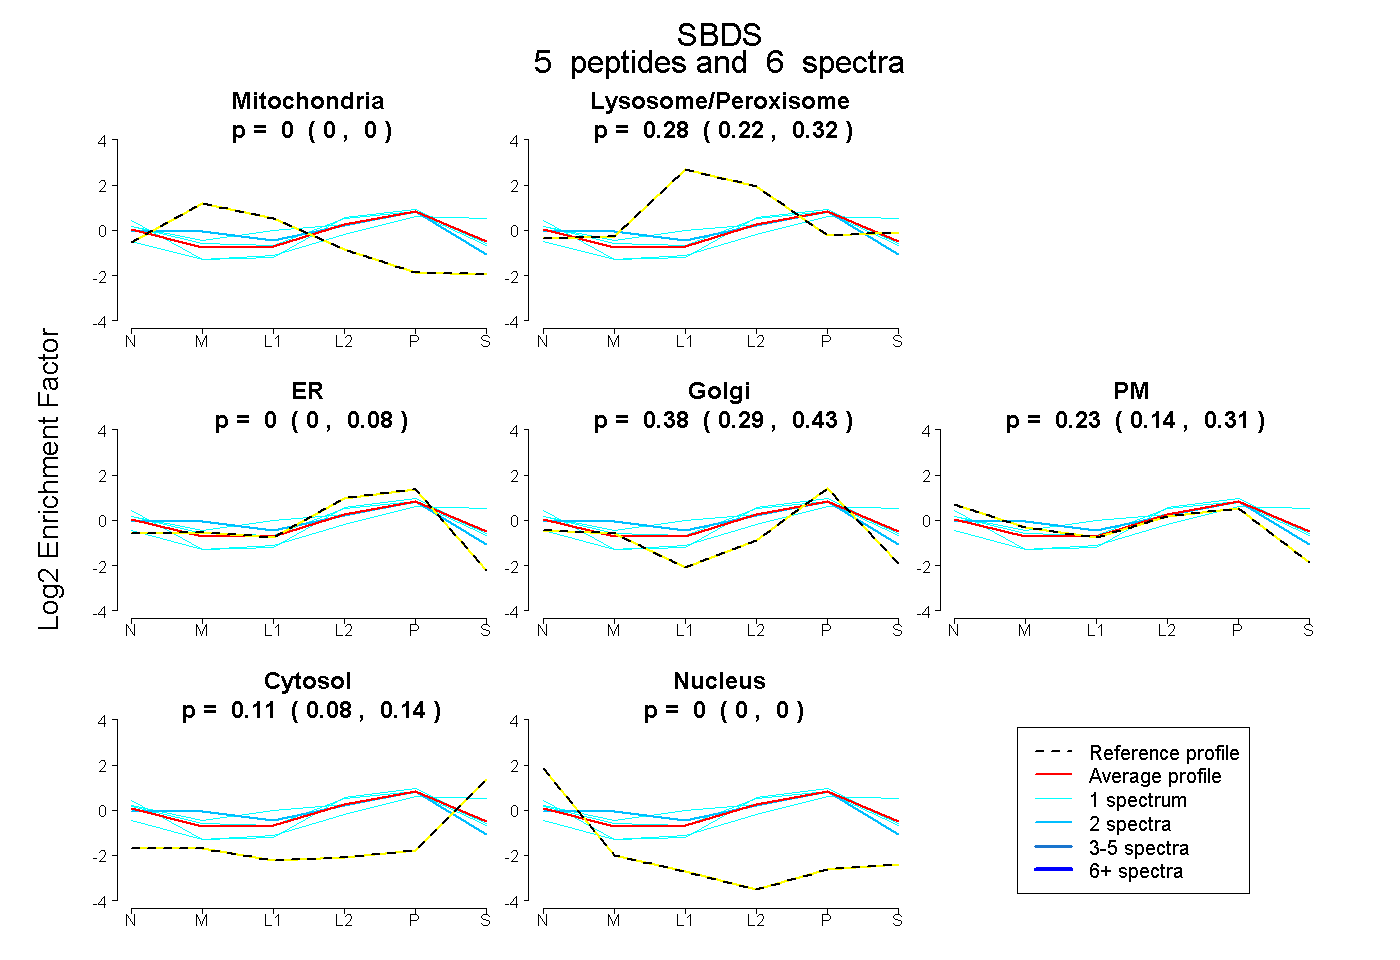
0.000 | 0.000
0.217 | 0.315
0.000 | 0.079
0.286 | 0.427
0.140 | 0.307
0.083 | 0.141
0.000 | 0.000
7peptides
spectra
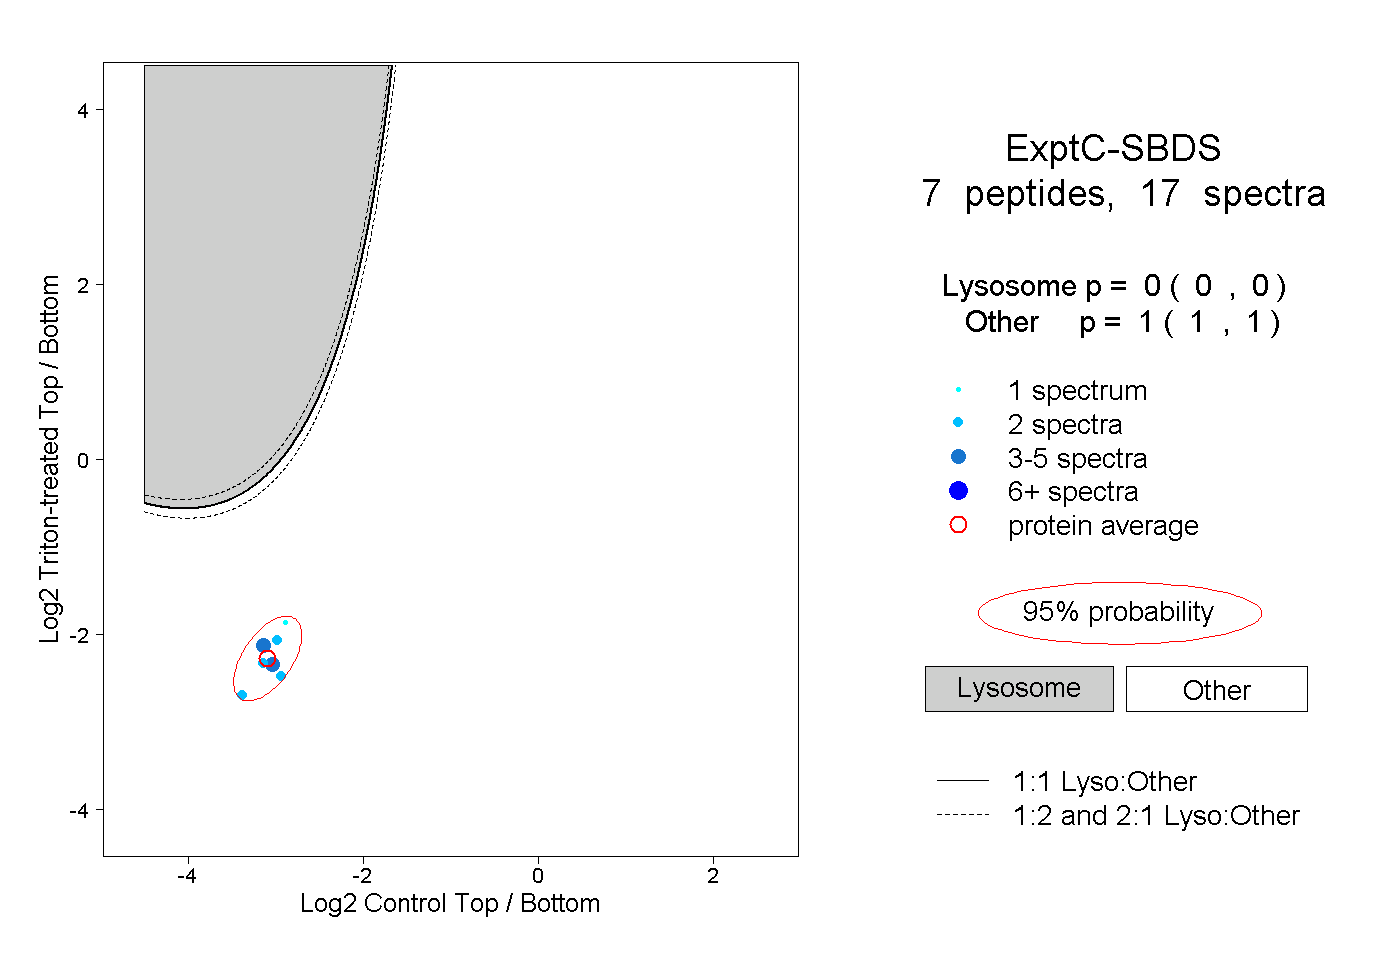
0.000 | 0.000
1.000 | 1.000
5peptides
spectra
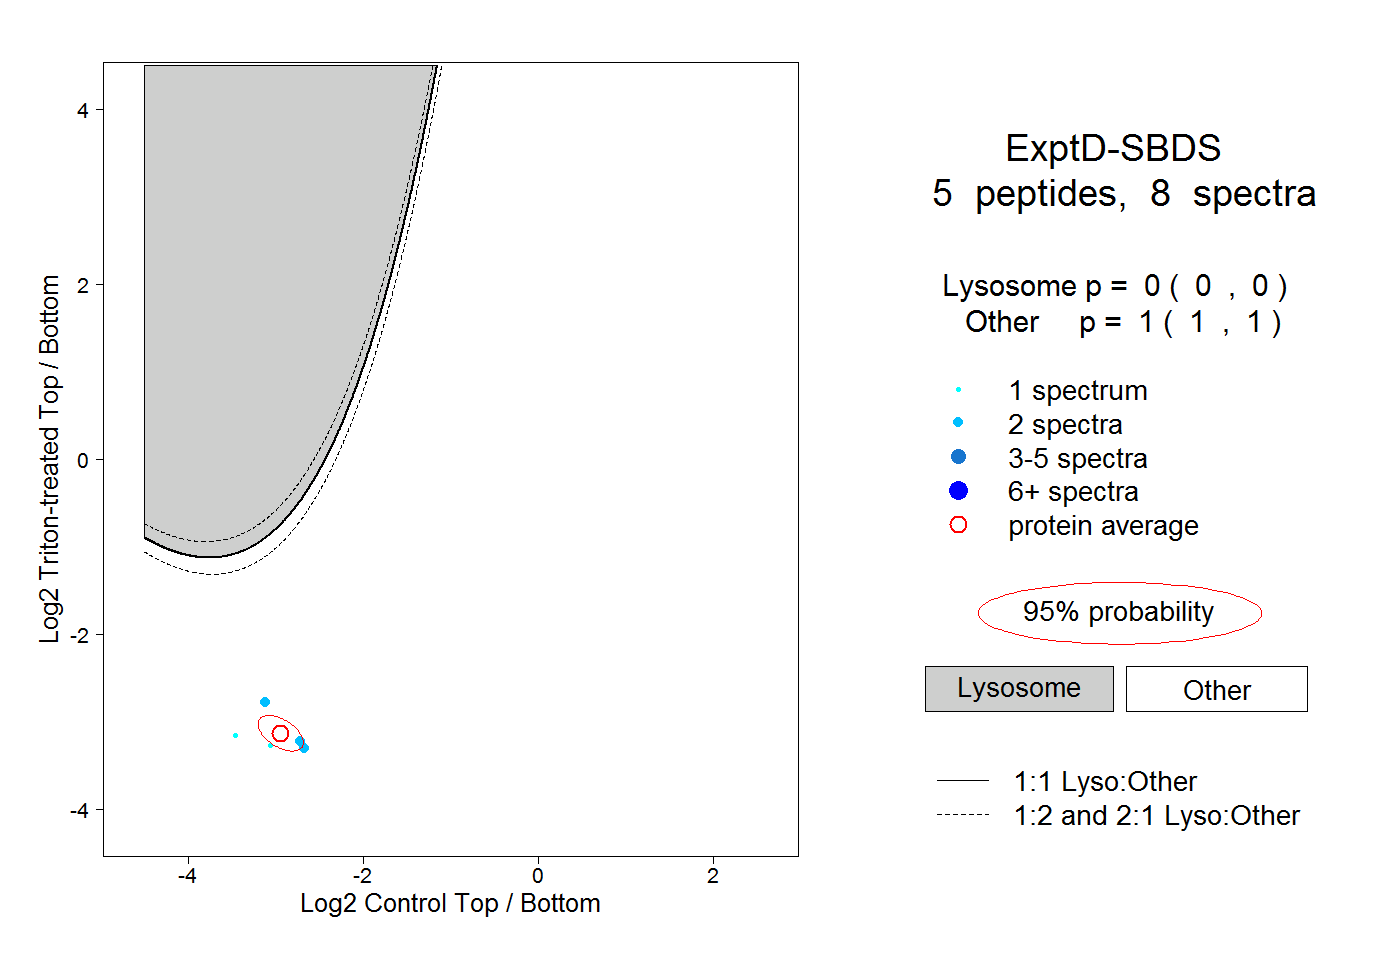
0.000 | 0.000
1.000 | 1.000