 12
12peptides
spectra
0.000 | 0.000
0.000 | 0.000
0.000 | 0.000
0.674 | 0.682
0.000 | 0.000
0.000 | 0.000
0.304 | 0.315
0.006 | 0.017
| Plot | Mito | Lyso | Perox | ER | Golgi | PM | Cytosol | Nucleus | |||||
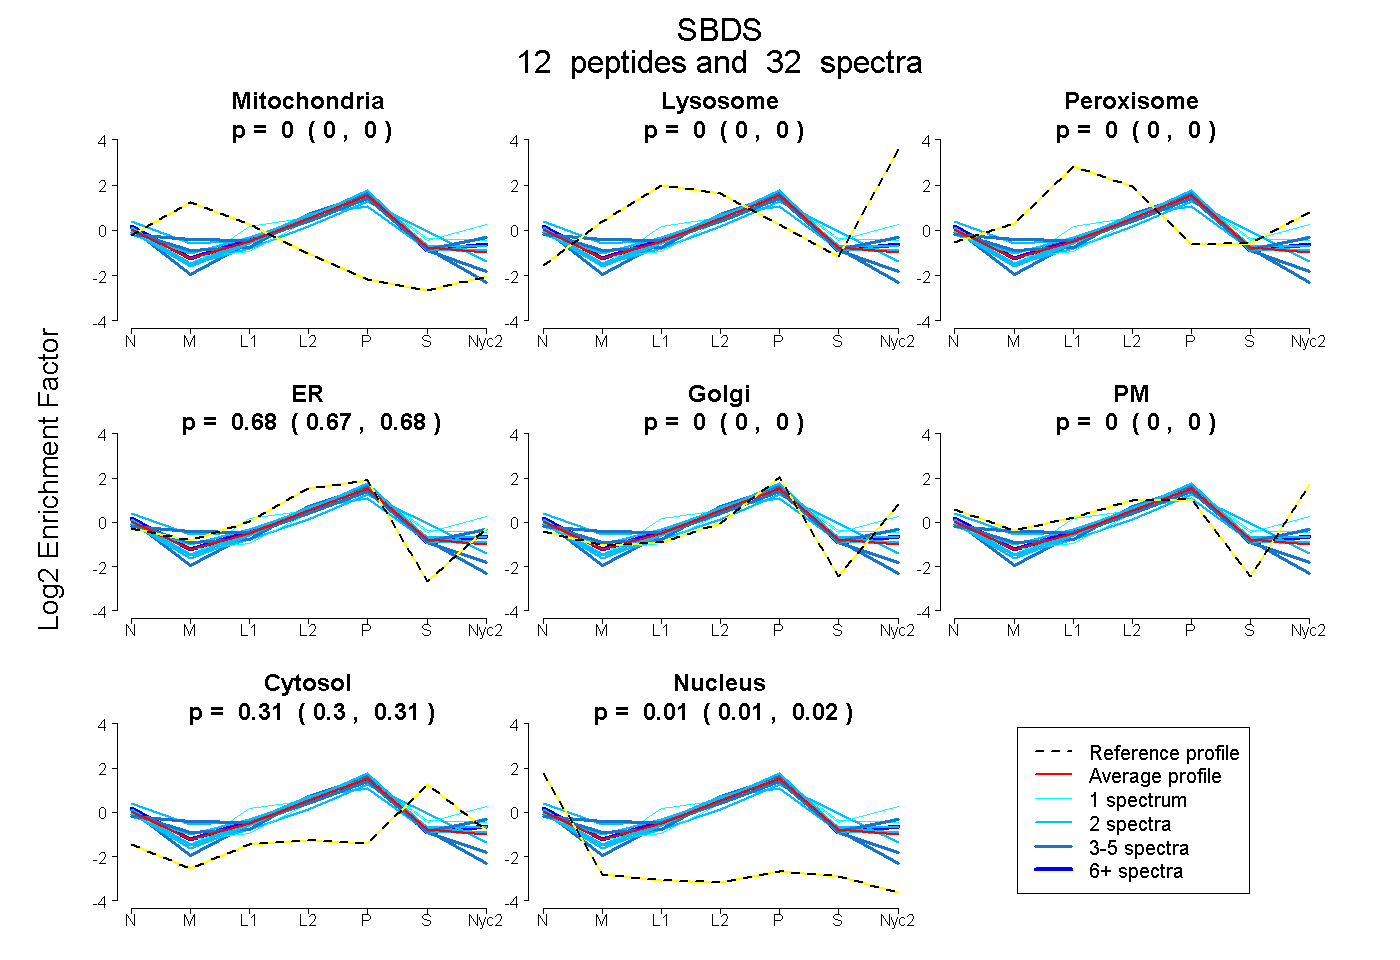
| Expt A |
12 peptides |
32 spectra |
|
0.000 0.000 | 0.000 |
0.000 0.000 | 0.000 |
0.000 0.000 | 0.000 |
0.678 0.674 | 0.682 |
0.000 0.000 | 0.000 |
0.000 0.000 | 0.000 |
0.310 0.304 | 0.315 |
0.012 0.006 | 0.017 |
| 2 spectra, LKPLMK | 0.000 | 0.000 | 0.000 | 0.676 | 0.004 | 0.000 | 0.320 | 0.000 | ||
| 4 spectra, DIATIVADK | 0.000 | 0.000 | 0.000 | 0.643 | 0.000 | 0.000 | 0.264 | 0.092 | ||
| 2 spectra, QQALEVIK | 0.017 | 0.000 | 0.088 | 0.616 | 0.000 | 0.000 | 0.215 | 0.064 | ||
| 2 spectra, CVNPETK | 0.000 | 0.000 | 0.000 | 0.679 | 0.000 | 0.000 | 0.306 | 0.015 | ||
| 2 spectra, FEIACYK | 0.000 | 0.000 | 0.000 | 0.533 | 0.000 | 0.000 | 0.444 | 0.024 | ||
| 1 spectrum, EDLISAFGTDDQTEICK | 0.000 | 0.000 | 0.073 | 0.600 | 0.006 | 0.000 | 0.321 | 0.000 | ||
| 2 spectra, FLLPVNEGK | 0.000 | 0.000 | 0.038 | 0.530 | 0.210 | 0.000 | 0.223 | 0.000 | ||
| 1 spectrum, GSLEVLSLK | 0.000 | 0.000 | 0.000 | 0.228 | 0.348 | 0.128 | 0.296 | 0.000 | ||
| 3 spectra, RPYTVILIER | 0.025 | 0.000 | 0.093 | 0.387 | 0.280 | 0.000 | 0.216 | 0.000 | ||
| 2 spectra, LTNVAVVR | 0.000 | 0.000 | 0.000 | 0.676 | 0.000 | 0.000 | 0.324 | 0.000 | ||
| 7 spectra, EIDELIK | 0.000 | 0.000 | 0.000 | 0.676 | 0.041 | 0.000 | 0.283 | 0.000 | ||
| 4 spectra, HTQLEQMFR | 0.000 | 0.000 | 0.000 | 0.670 | 0.000 | 0.000 | 0.237 | 0.092 |
| Plot | Mito | Lyso or Perox | ER | Golgi | PM | Cytosol | Nucleus | ||||||
| Expt B |
5 peptides |
6 spectra |
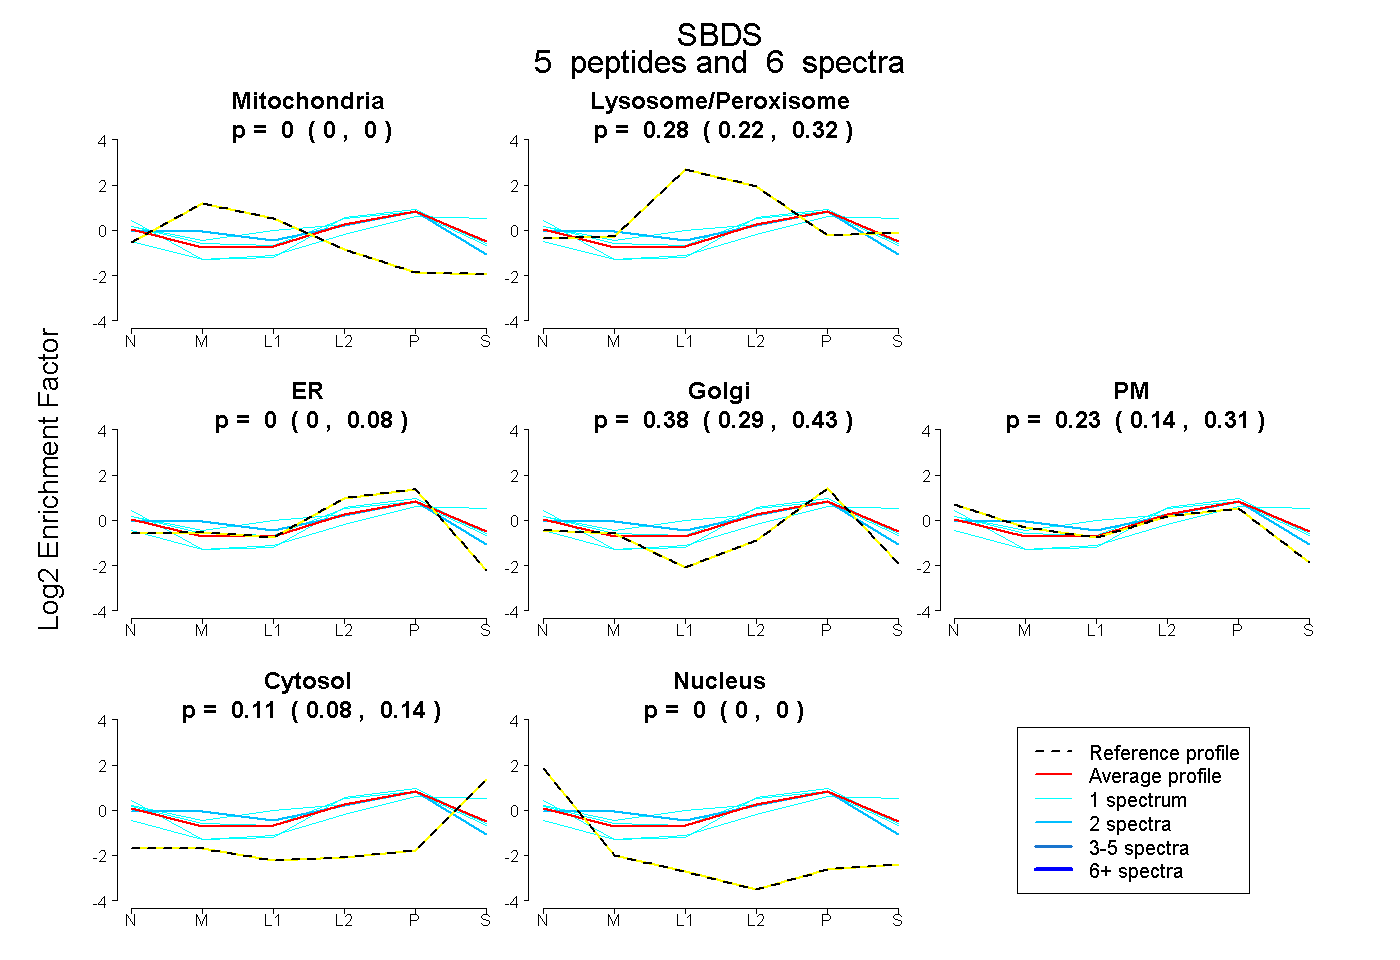 |
0.000 0.000 | 0.000 |
0.278 0.217 | 0.315 |
0.000 0.000 | 0.079 |
0.382 0.286 | 0.427 |
0.230 0.140 | 0.307 |
0.110 0.083 | 0.141 |
0.000 0.000 | 0.000 |
|||
| Plot | Lyso | Other | |||||||||||
| Expt C |
7 peptides |
17 spectra |
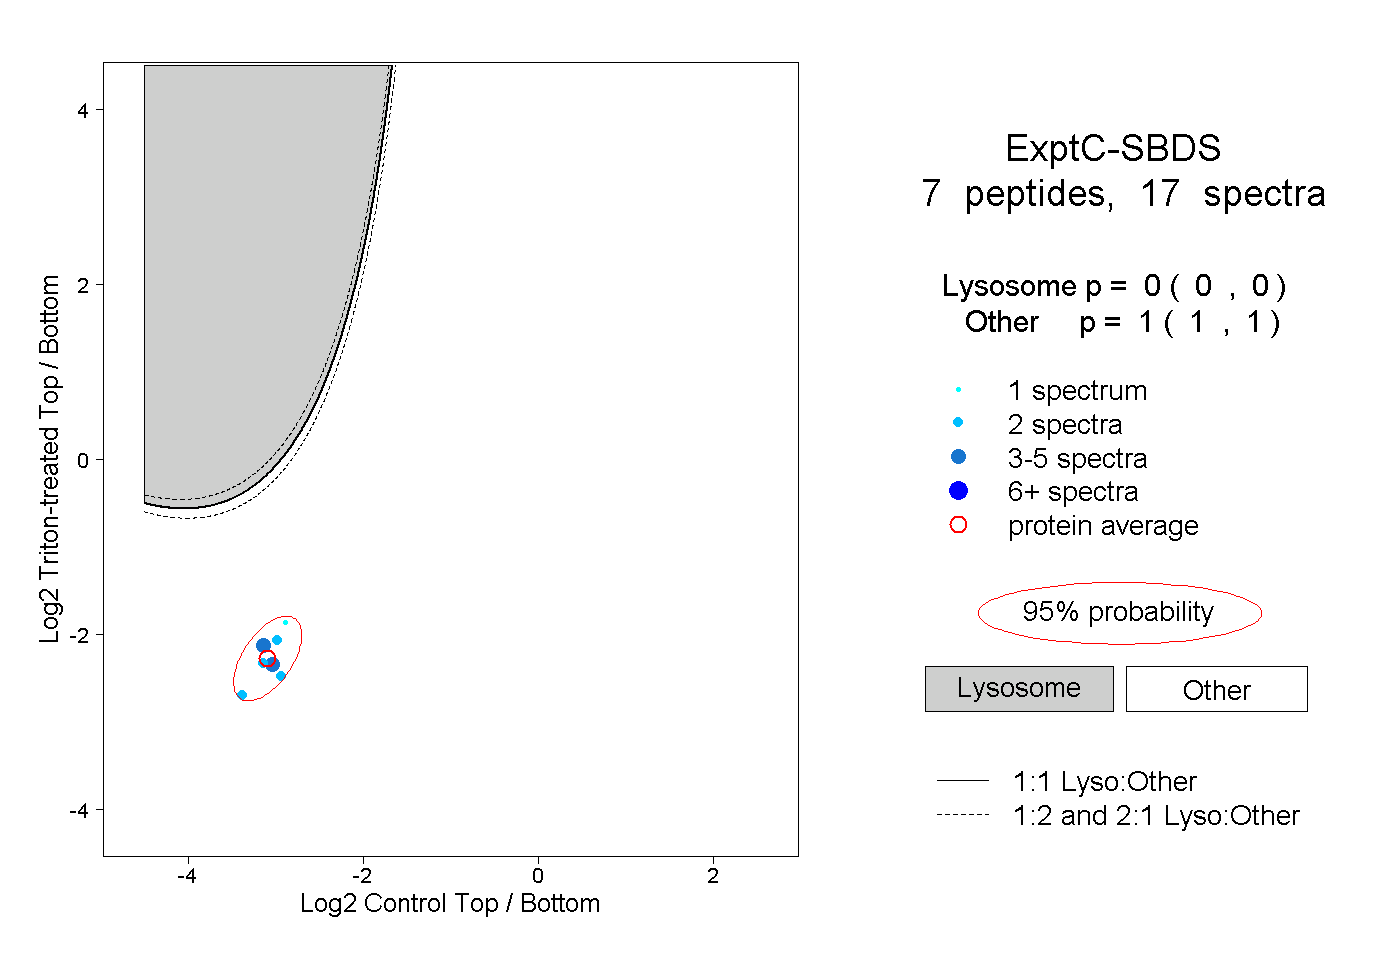 |
0.000 0.000 | 0.000 |
1.000 1.000 | 1.000 |
||||||||
| Plot | Lyso | Other | |||||||||||
| Expt D |
5 peptides |
8 spectra |
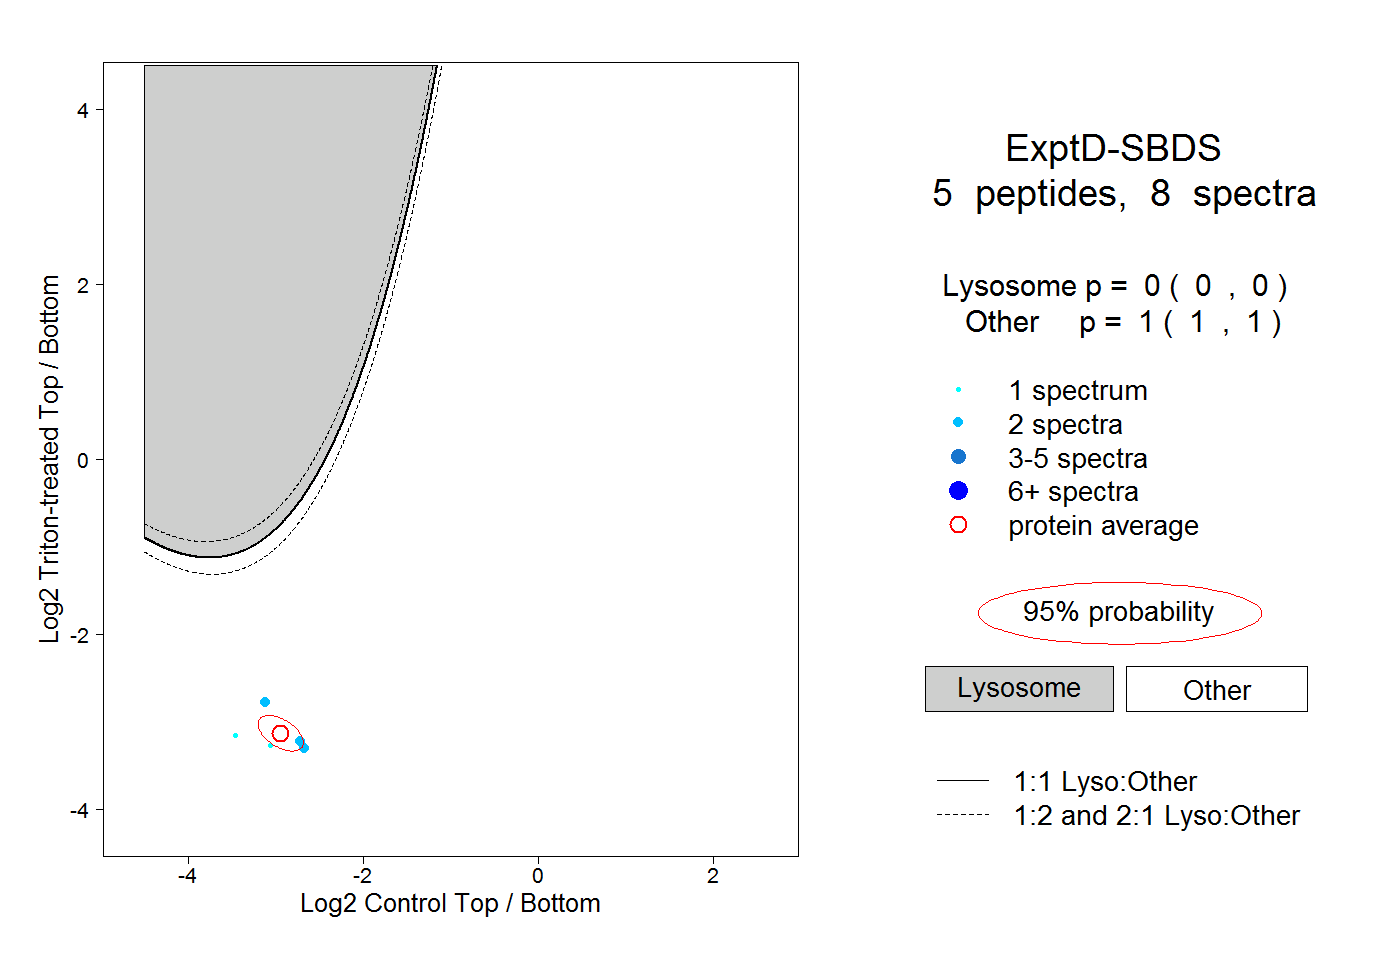 |
0.000 0.000 | 0.000 |
1.000 1.000 | 1.000 |