SBDS
[ENSRNOP00000001190]
Main page
| | | Plot |
Mito |
Lyso |
|
Perox |
ER |
Golgi |
PM |
Cytosol |
Nucleus |
|
| Expt A |
 12
12
peptides |
32
spectra |
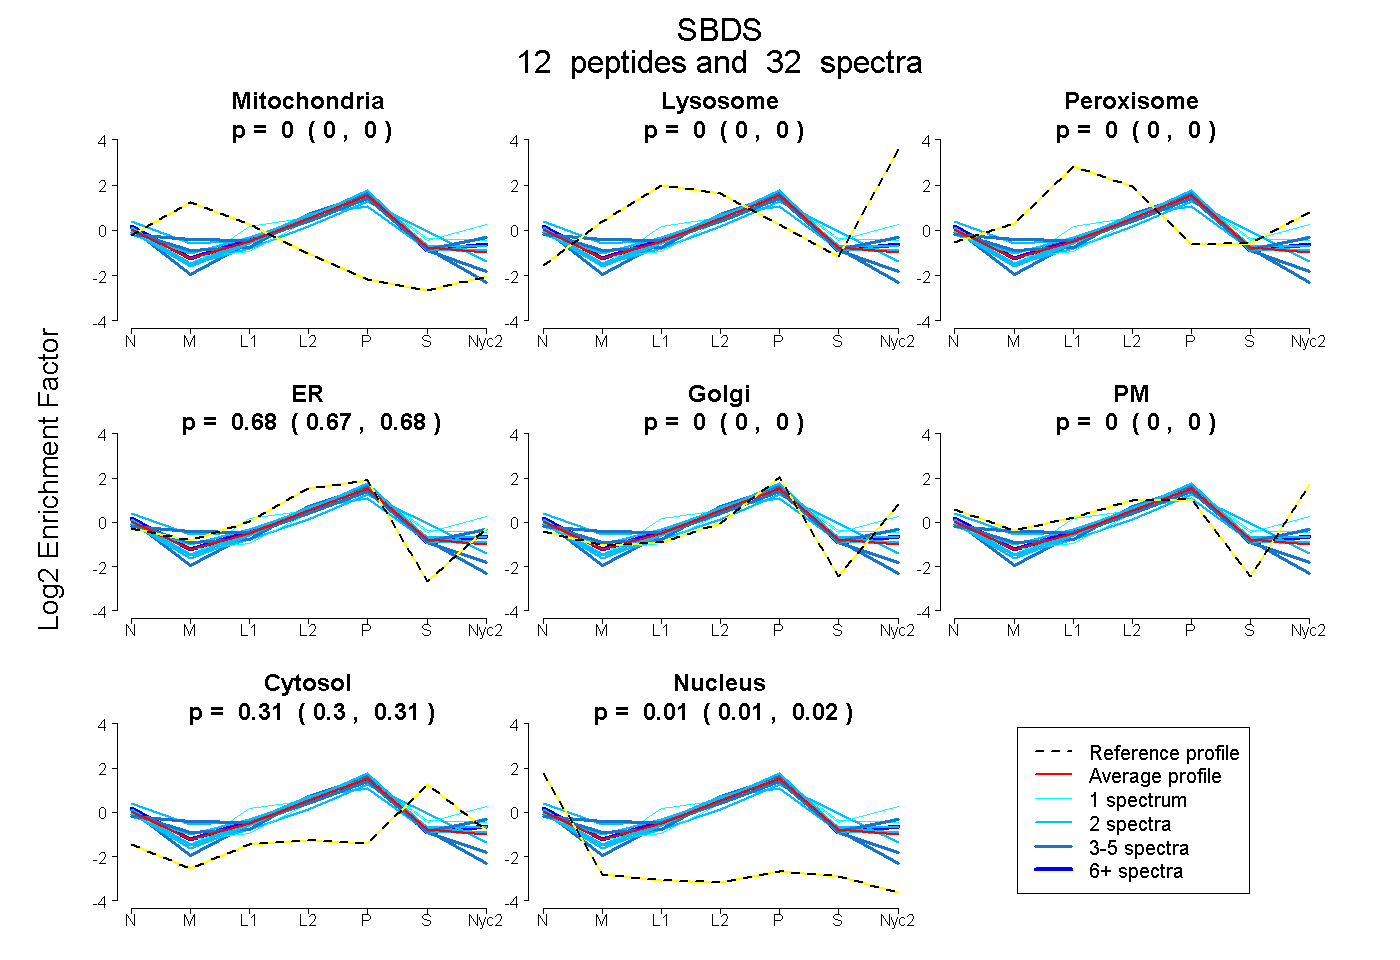 |
0.000
0.000 | 0.000 |
0.000
0.000 | 0.000 |
|
0.000
0.000 | 0.000 |
0.678
0.674 | 0.682 |
0.000
0.000 | 0.000 |
0.000
0.000 | 0.000 |
0.310
0.304 | 0.315 |
0.012
0.006 | 0.017 |
|
| | | Plot |
Mito |
|
Lyso or Perox |
|
ER |
Golgi |
PM |
Cytosol |
Nucleus |
|
| Expt B |
5
peptides |
6
spectra |
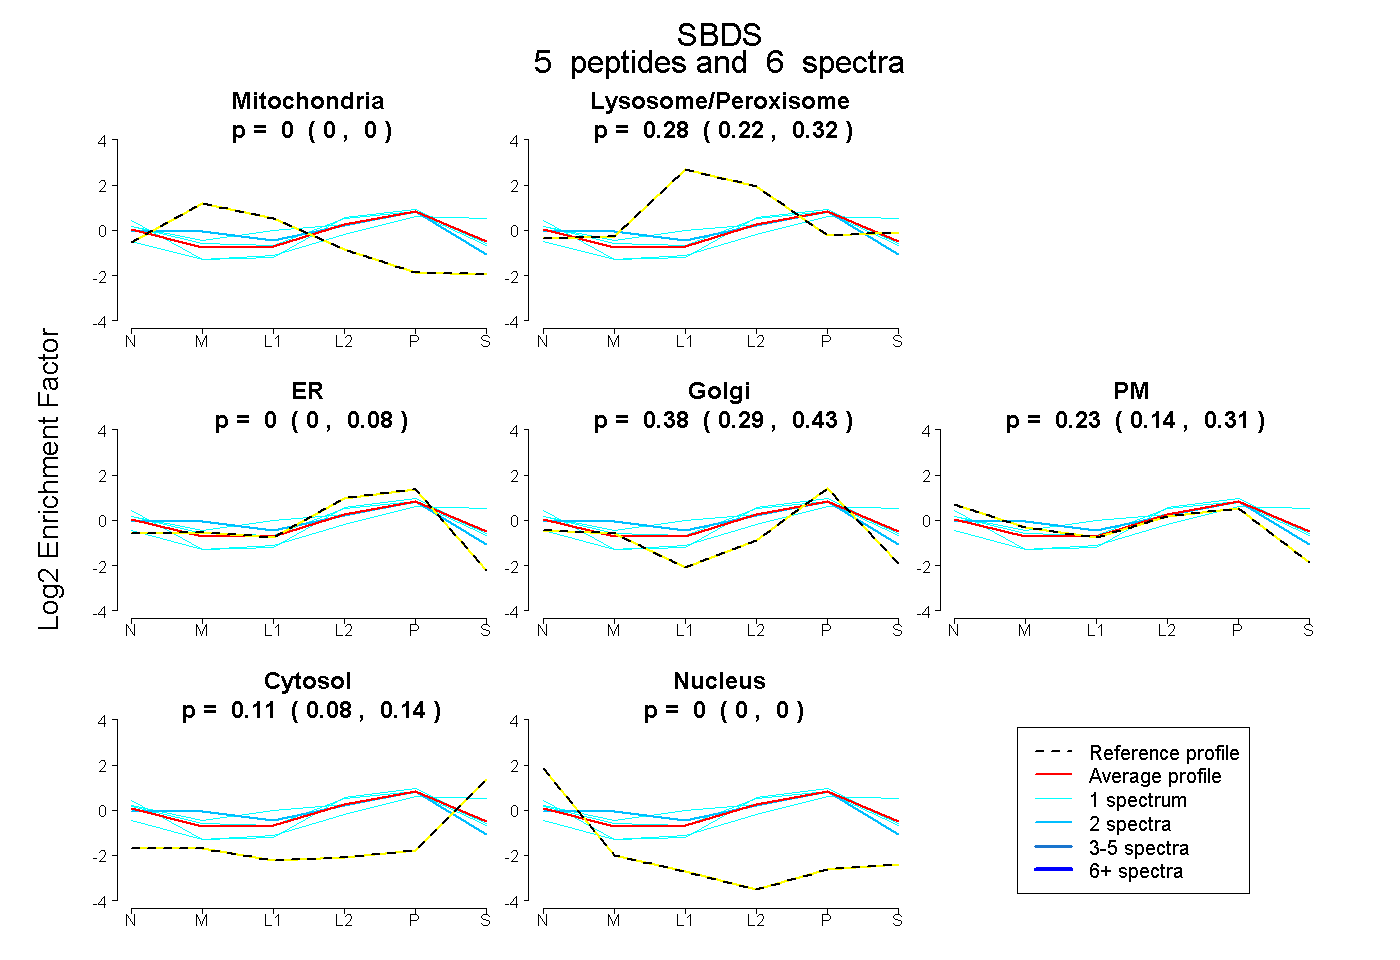 |
0.000
0.000 | 0.000 |
|
0.278
0.217 | 0.315 |
|
0.000
0.000 | 0.079 |
0.382
0.286 | 0.427 |
0.230
0.140 | 0.307 |
0.110
0.083 | 0.141 |
0.000
0.000 | 0.000 |
|
| 1 spectrum, DIATIVADK |
0.000 |
|
0.044 |
|
0.314 |
0.000 |
0.467 |
0.175 |
0.000 |
|
| 2 spectra, RPYTVILIER |
0.000 |
|
0.293 |
|
0.000 |
0.460 |
0.246 |
0.001 |
0.000 |
|
| 1 spectrum, LTNVAVVR |
0.000 |
|
0.248 |
|
0.074 |
0.265 |
0.326 |
0.087 |
0.000 |
|
| 1 spectrum, EIDELIK |
0.000 |
|
0.356 |
|
0.000 |
0.322 |
0.277 |
0.044 |
0.000 |
|
| 1 spectrum, FLLPVNEGK |
0.000 |
|
0.264 |
|
0.000 |
0.389 |
0.000 |
0.346 |
0.000 |
|
| | | Plot |
|
Lyso |
|
|
|
|
|
|
|
Other |
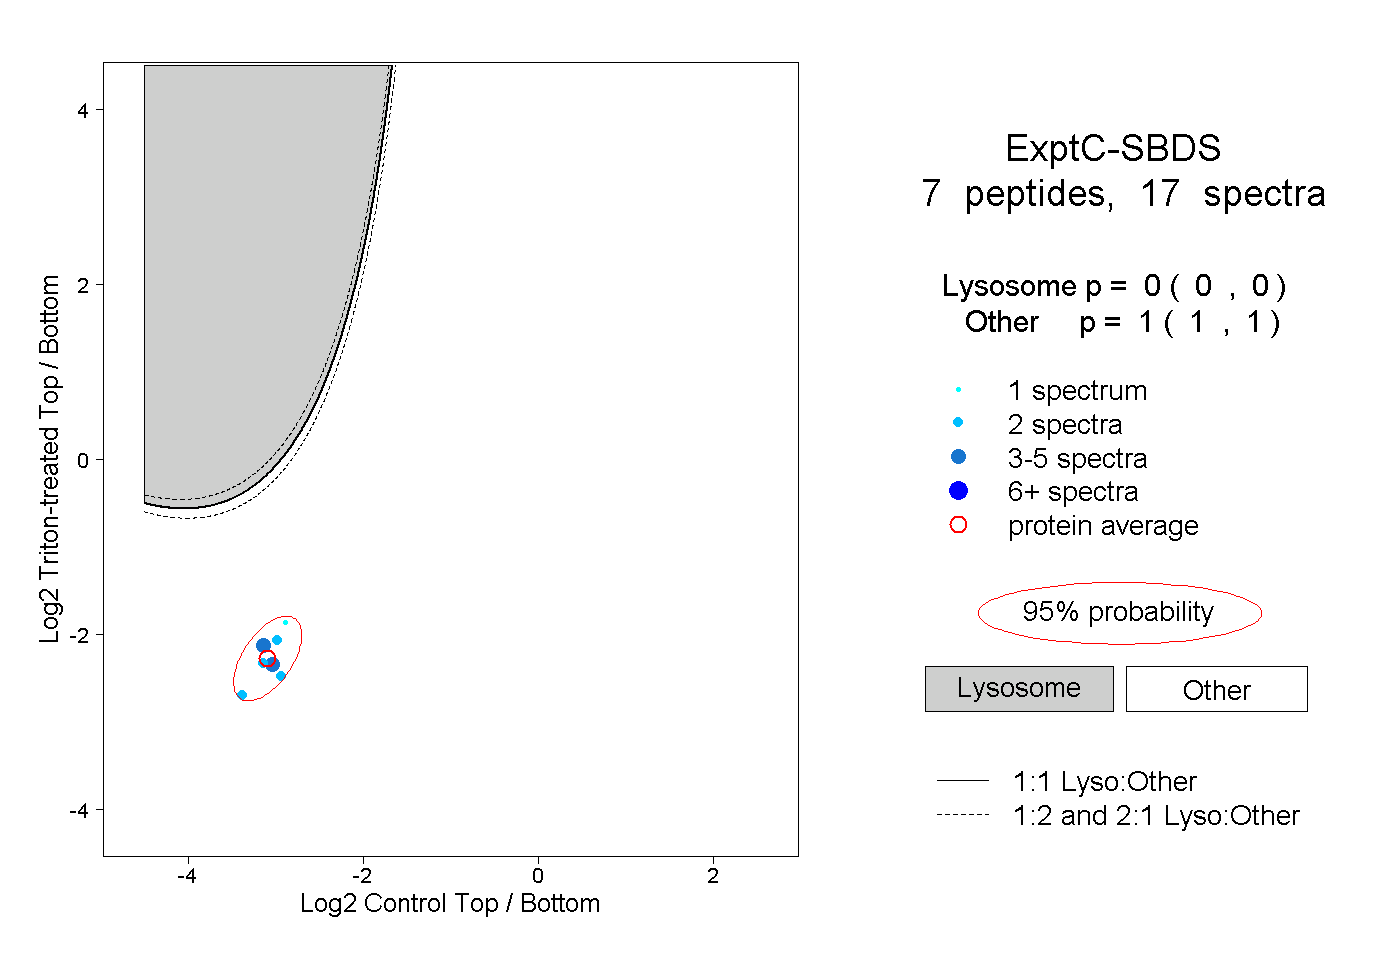
| Expt C |
7
peptides |
17
spectra |
 |
|
0.000
0.000 | 0.000 |
|
|
|
|
|
|
|
1.000
1.000 | 1.000 |
| | | Plot |
|
Lyso |
|
|
|
|
|
|
|
Other |
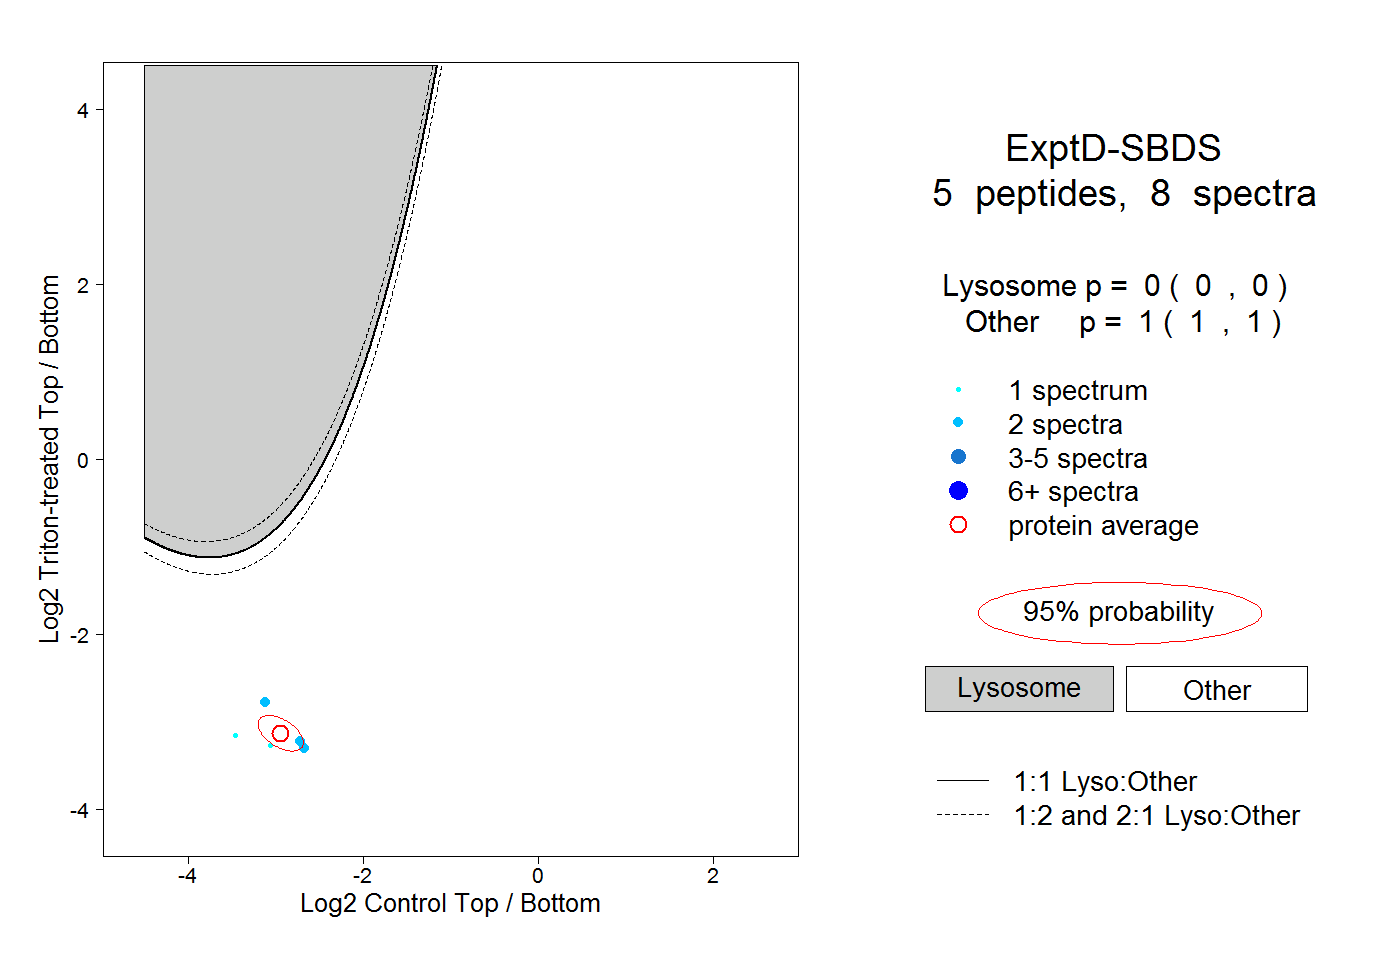
| Expt D |
5
peptides |
8
spectra |
 |
|
0.000
0.000 | 0.000 |
|
|
|
|
|
|
|
1.000
1.000 | 1.000 |