 13
13peptides
spectra
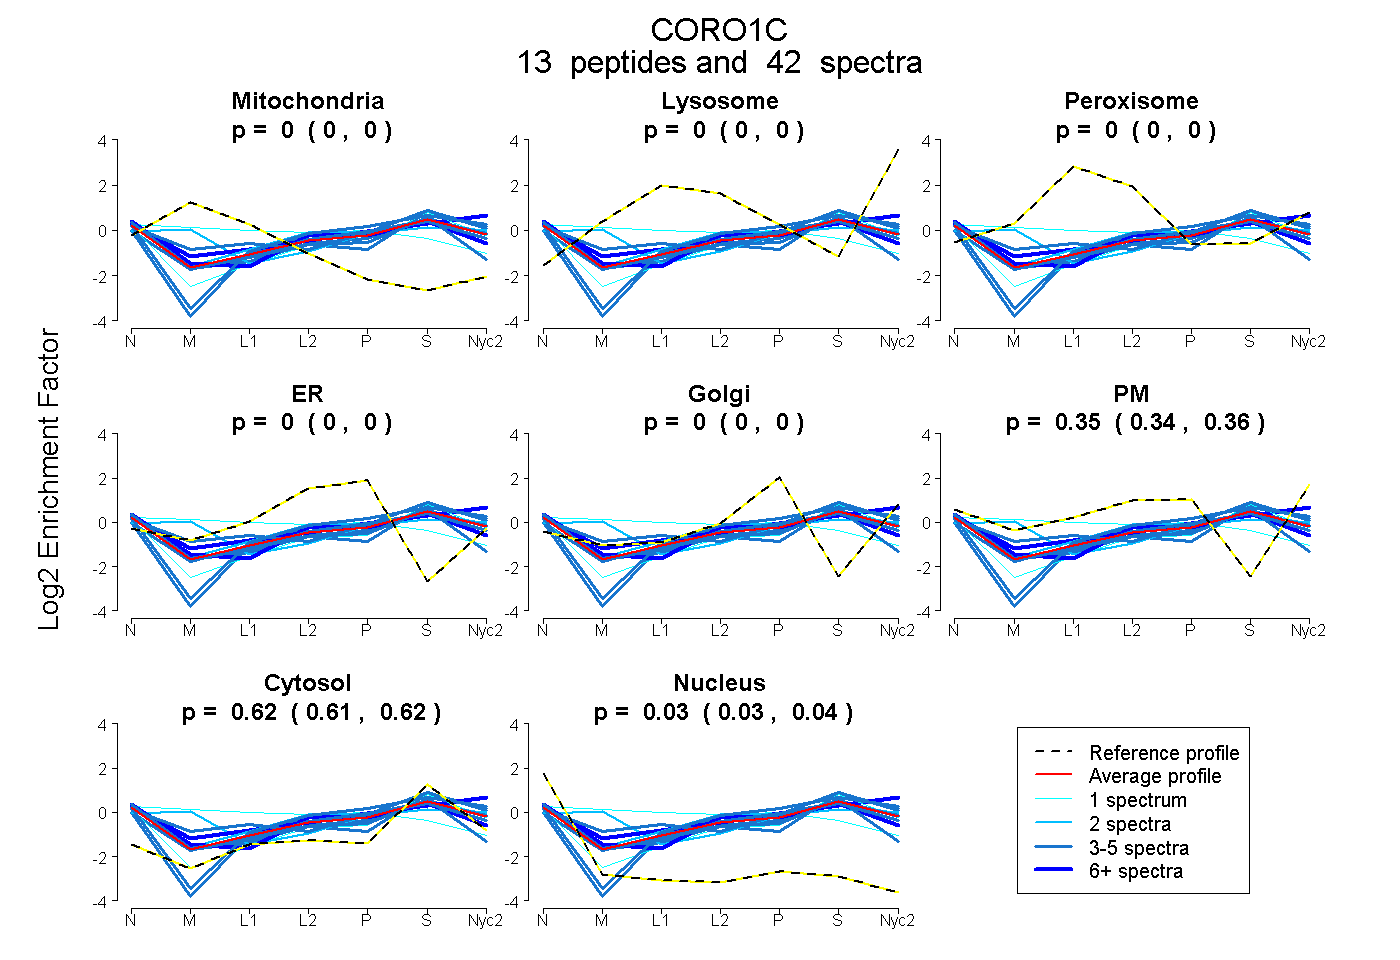
0.000 | 0.000
0.000 | 0.000
0.000 | 0.000
0.000 | 0.000
0.000 | 0.000
0.344 | 0.356
0.611 | 0.622
0.028 | 0.036
4peptides
spectra
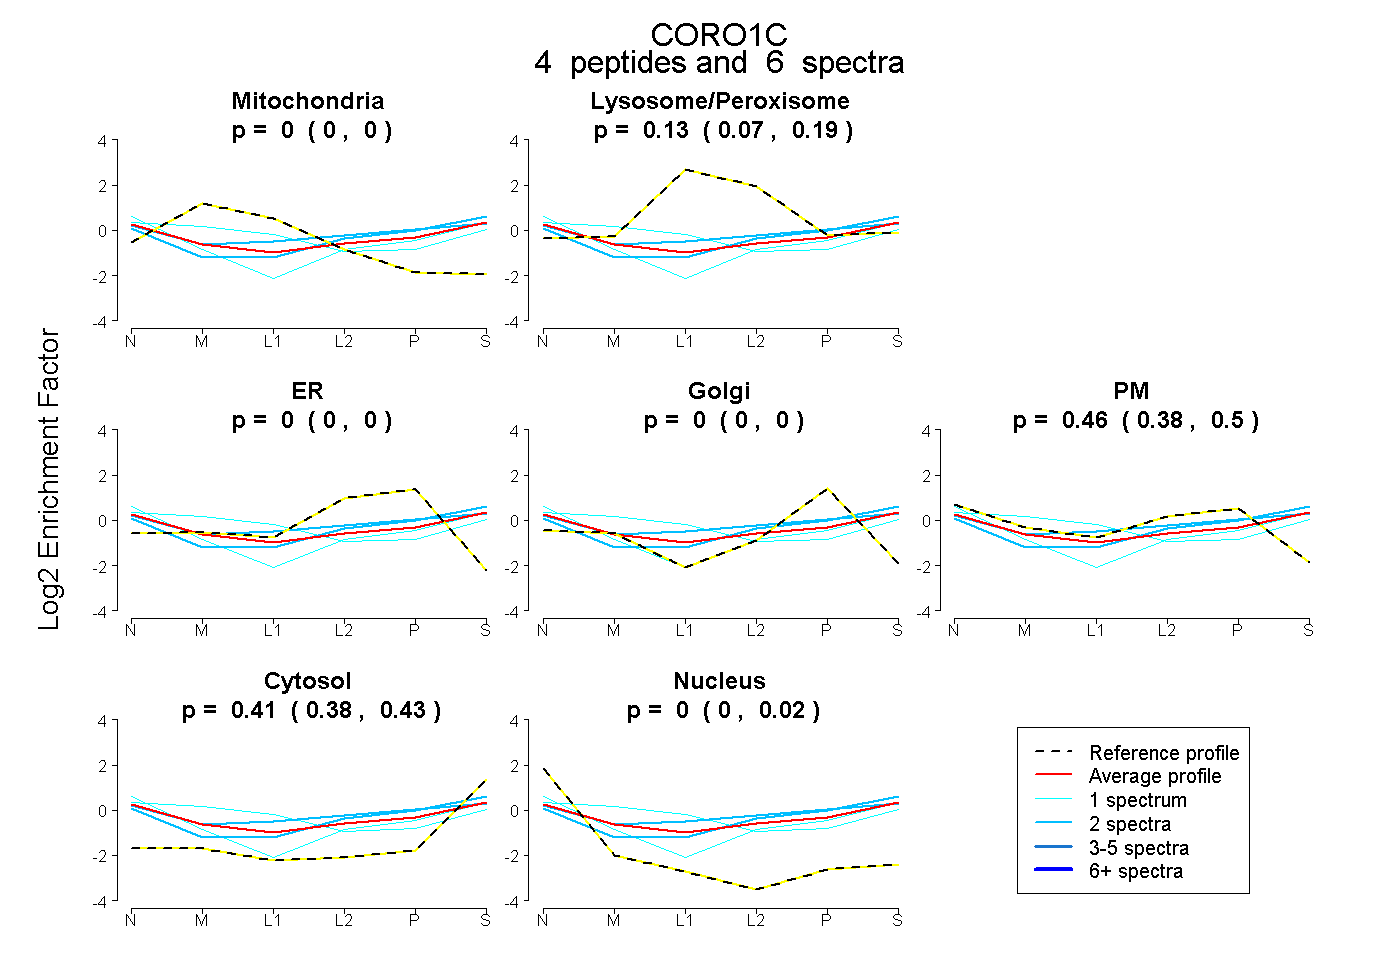
0.000 | 0.000
0.069 | 0.188
0.000 | 0.000
0.000 | 0.000
0.382 | 0.502
0.380 | 0.432
0.000 | 0.024
12peptides
spectra
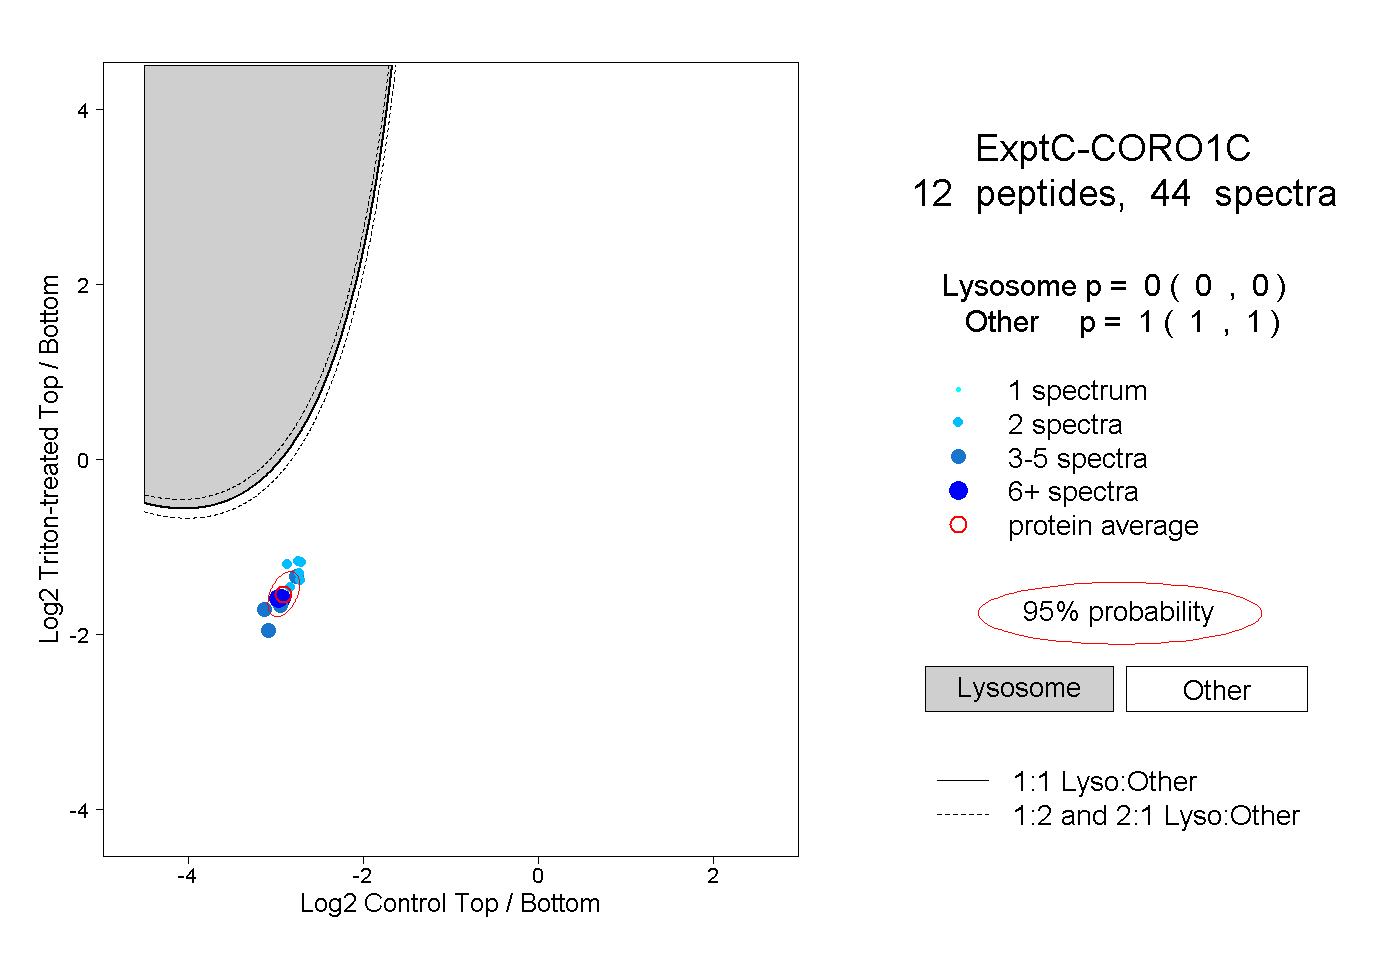
0.000 | 0.000
1.000 | 1.000
3peptides
spectra
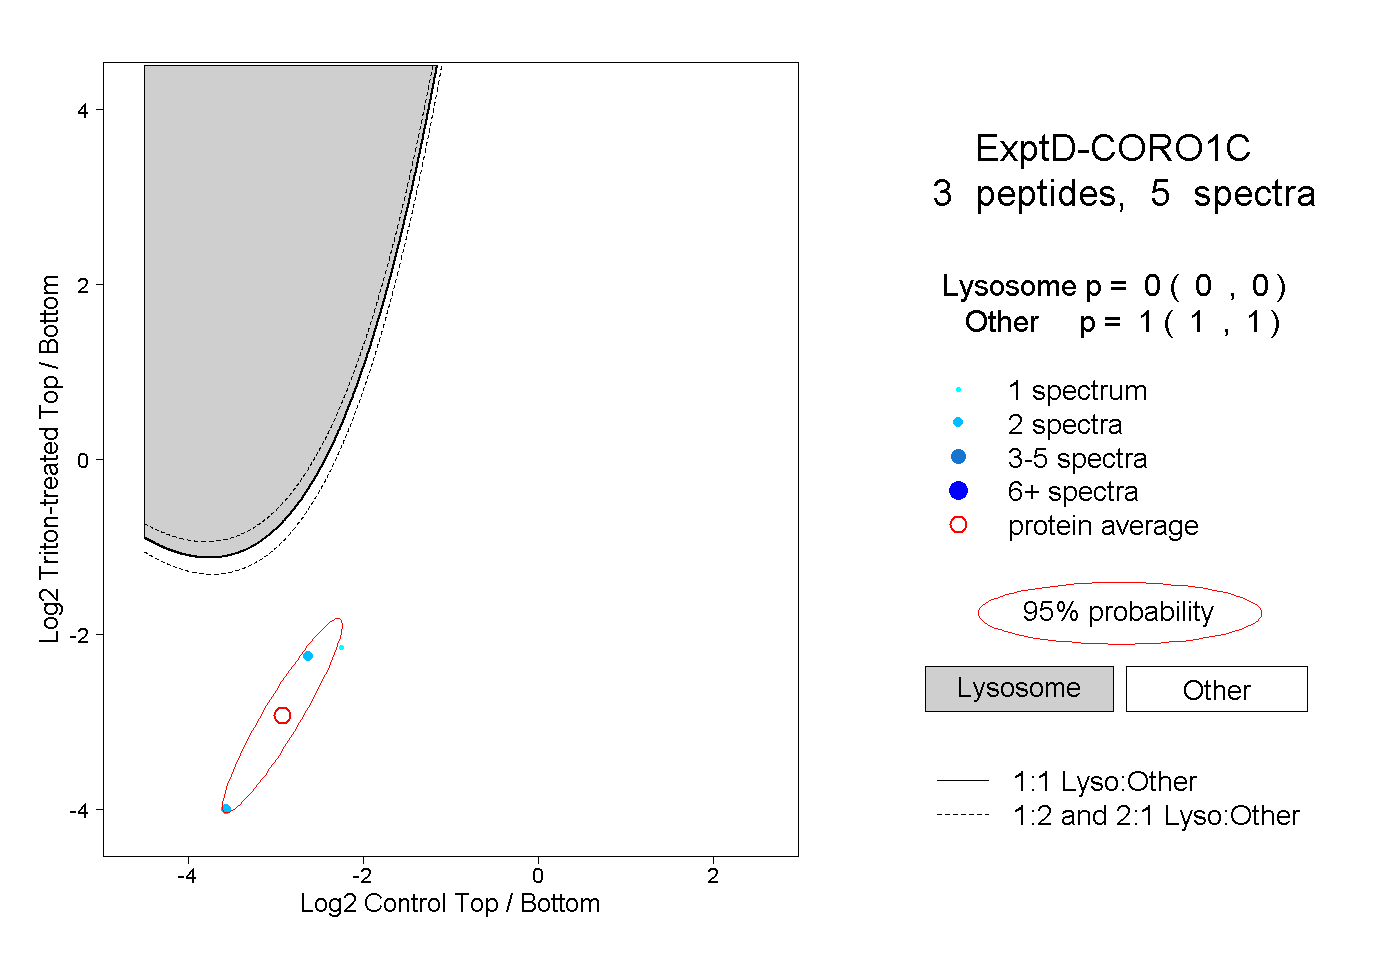
0.000 | 0.000
1.000 | 1.000