CORO1C
[ENSRNOP00000000886]
Main page
| | | Plot |
Mito |
Lyso |
|
Perox |
ER |
Golgi |
PM |
Cytosol |
Nucleus |
|
| Expt A |
 13
13
peptides |
42
spectra |
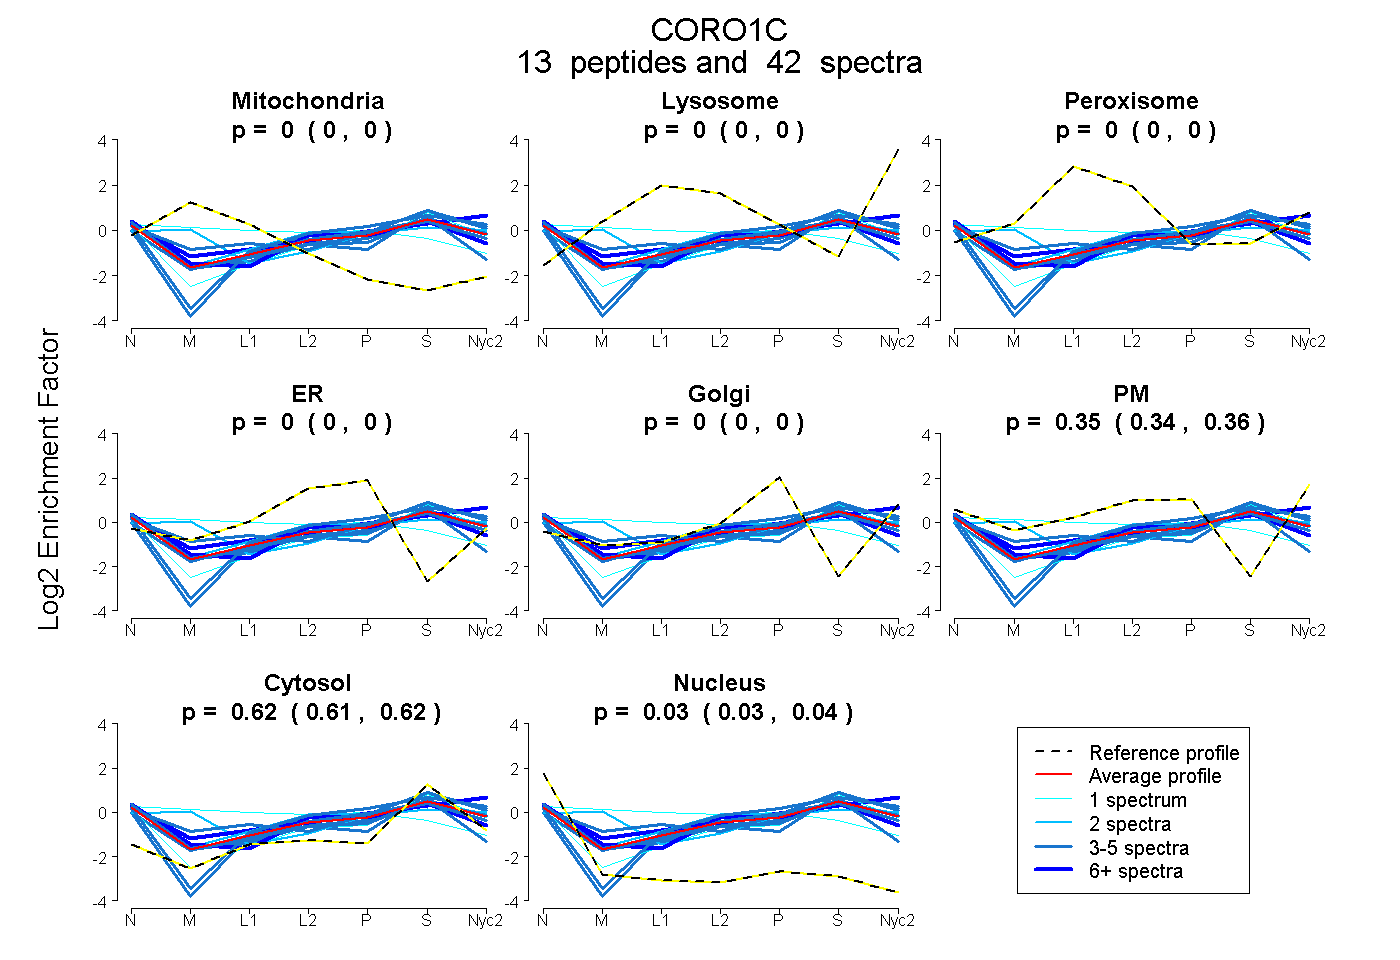 |
0.000
0.000 | 0.000 |
0.000
0.000 | 0.000 |
|
0.000
0.000 | 0.000 |
0.000
0.000 | 0.000 |
0.000
0.000 | 0.000 |
0.351
0.344 | 0.356 |
0.617
0.611 | 0.622 |
0.032
0.028 | 0.036 |
|
| | | Plot |
Mito |
|
Lyso or Perox |
|
ER |
Golgi |
PM |
Cytosol |
Nucleus |
|
| Expt B |
4
peptides |
6
spectra |
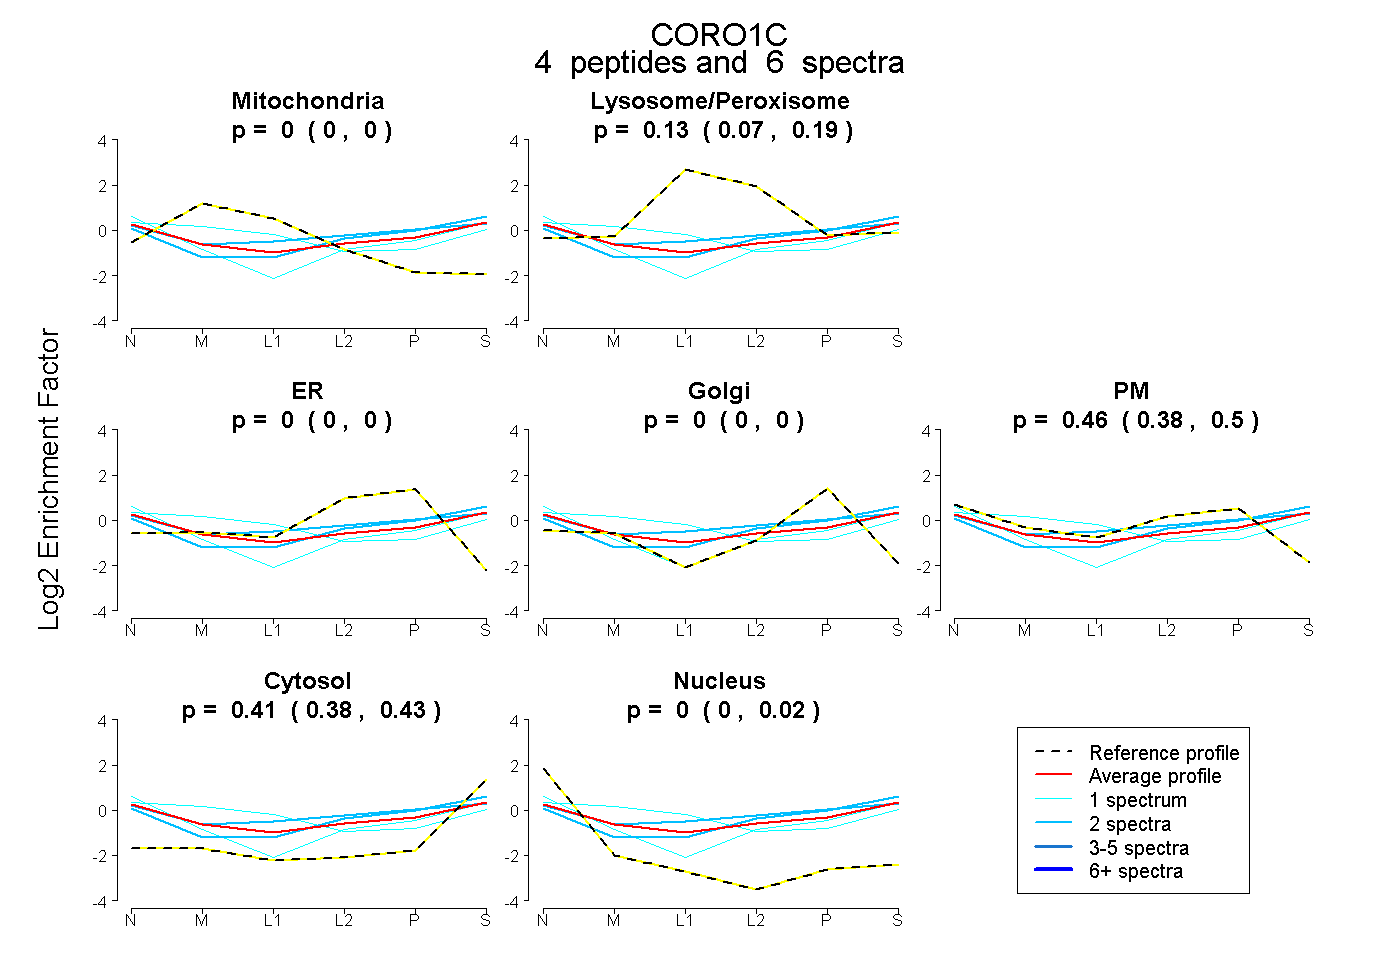 |
0.000
0.000 | 0.000 |
|
0.129
0.069 | 0.188 |
|
0.000
0.000 | 0.000 |
0.000
0.000 | 0.000 |
0.460
0.382 | 0.502 |
0.411
0.380 | 0.432 |
0.000
0.000 | 0.024 |
|
| | | Plot |
|
Lyso |
|
|
|
|
|
|
|
Other |
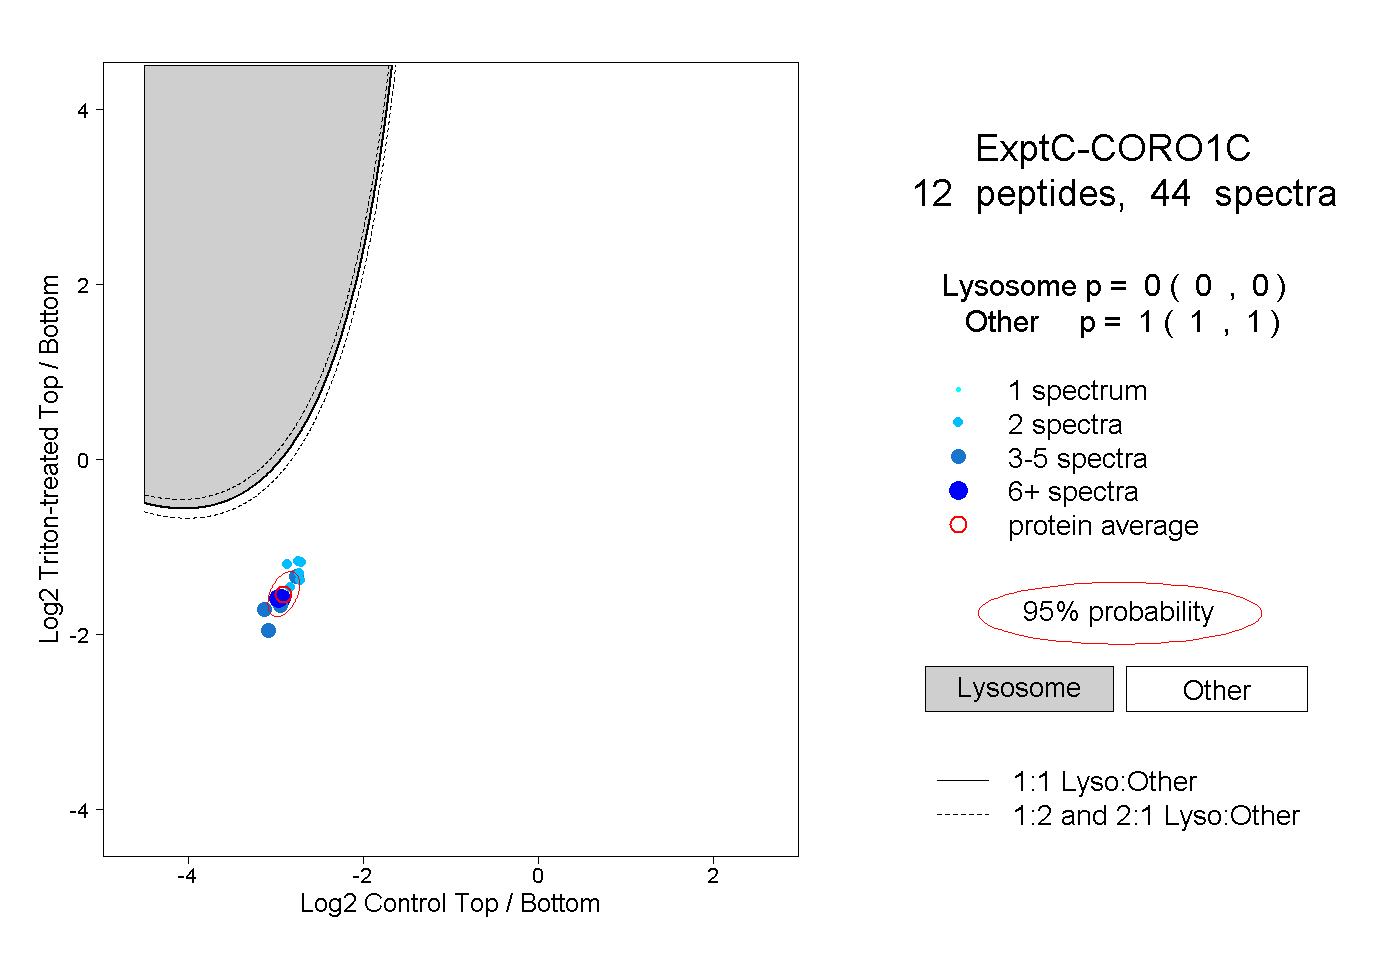
| Expt C |
12
peptides |
44
spectra |
 |
|
0.000
0.000 | 0.000 |
|
|
|
|
|
|
|
1.000
1.000 | 1.000 |
| 2 spectra, NADPILISLK |
|
0.000 |
|
|
|
|
|
|
|
1.000 |
| 4 spectra, DTICNQDER |
|
0.000 |
|
|
|
|
|
|
|
1.000 |
| 4 spectra, NILDSKPAANK |
|
0.000 |
|
|
|
|
|
|
|
1.000 |
| 2 spectra, SDLICAPK |
|
0.000 |
|
|
|
|
|
|
|
1.000 |
| 8 spectra, HVFGQAVK |
|
0.000 |
|
|
|
|
|
|
|
1.000 |
| 2 spectra, NDQCYDDIR |
|
0.000 |
|
|
|
|
|
|
|
1.000 |
| 8 spectra, QLALWNPK |
|
0.000 |
|
|
|
|
|
|
|
1.000 |
| 3 spectra, GMGYMPK |
|
0.000 |
|
|
|
|
|
|
|
1.000 |
| 2 spectra, TTDTASVQNEAK |
|
0.000 |
|
|
|
|
|
|
|
1.000 |
| 2 spectra, GLDVNK |
|
0.000 |
|
|
|
|
|
|
|
1.000 |
| 2 spectra, NGSLICTASK |
|
0.000 |
|
|
|
|
|
|
|
1.000 |
| 5 spectra, HGYIPGK |
|
0.000 |
|
|
|
|
|
|
|
1.000 |
| | | Plot |
|
Lyso |
|
|
|
|
|
|
|
Other |
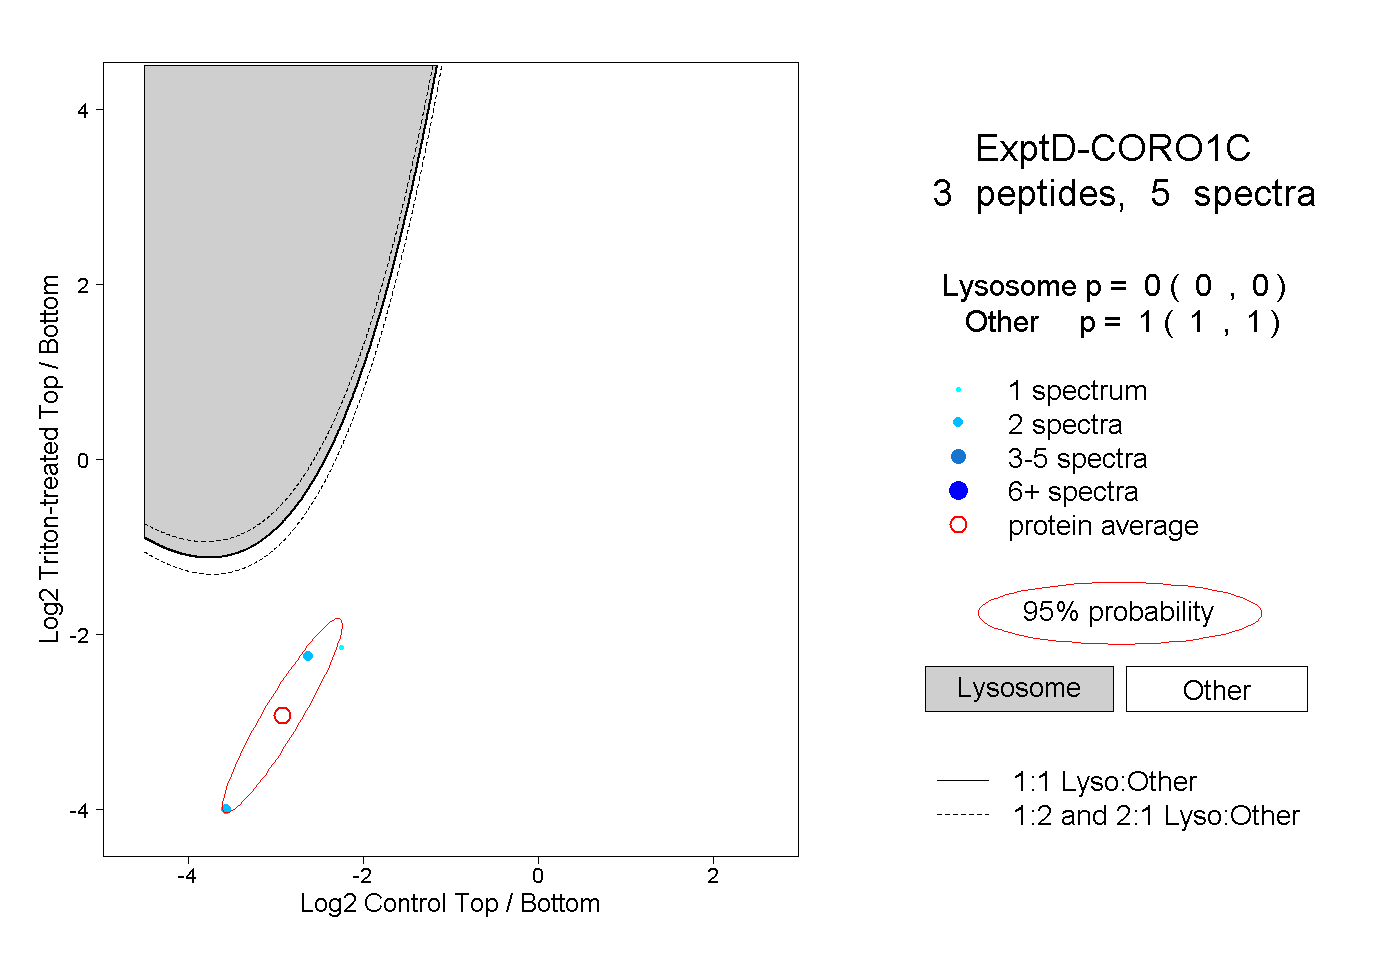
| Expt D |
3
peptides |
5
spectra |
 |
|
0.000
0.000 | 0.000 |
|
|
|
|
|
|
|
1.000
1.000 | 1.000 |