 13
13peptides
spectra
0.000 | 0.000
0.000 | 0.000
0.000 | 0.000
0.000 | 0.000
0.000 | 0.000
0.344 | 0.356
0.611 | 0.622
0.028 | 0.036
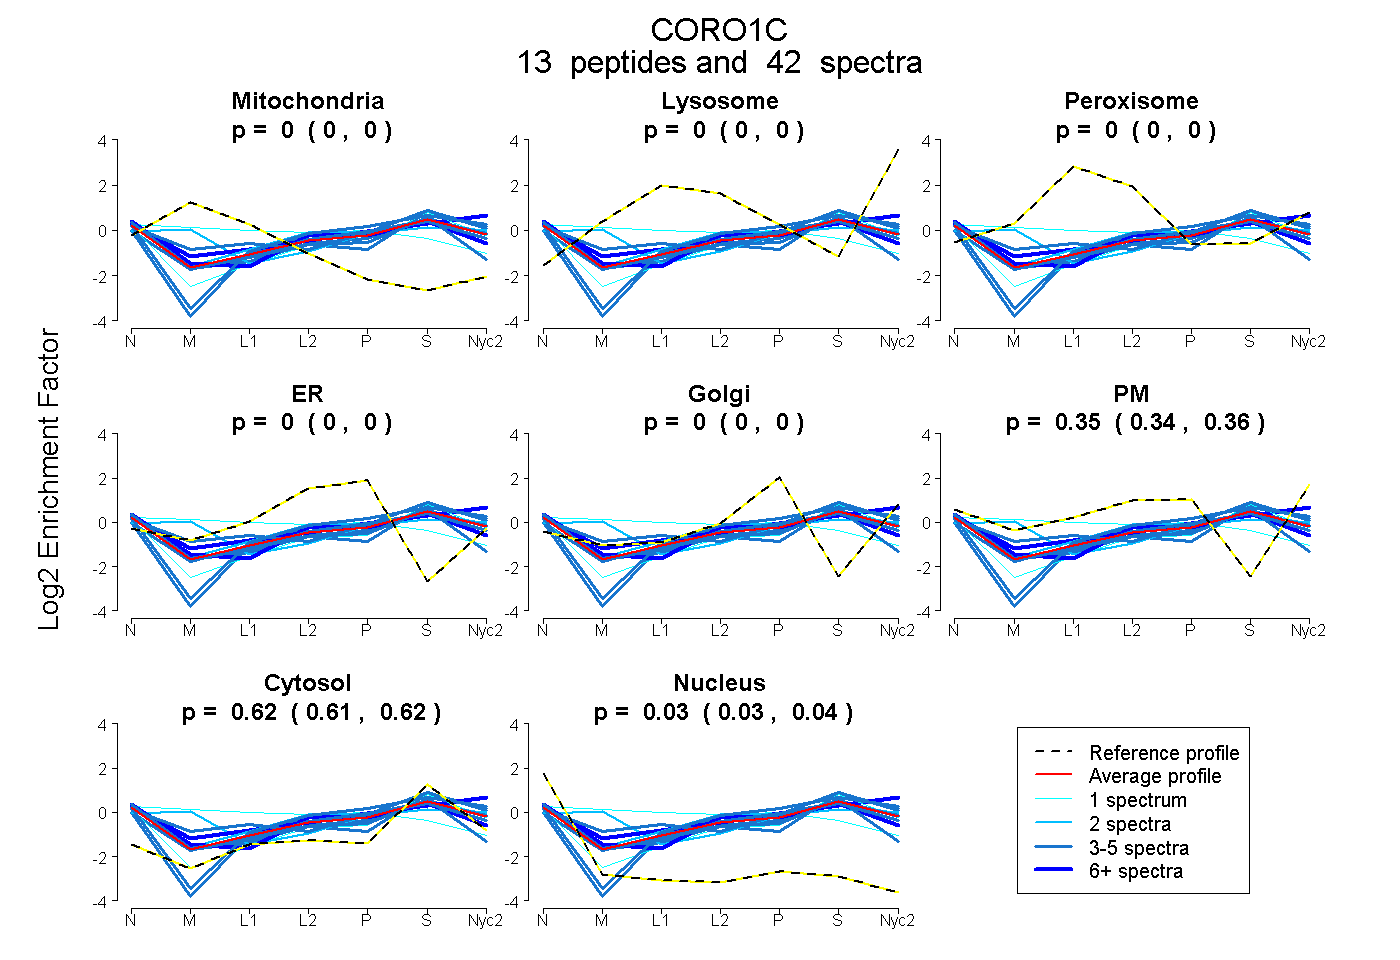
| Plot | Mito | Lyso | Perox | ER | Golgi | PM | Cytosol | Nucleus | |||||
| Expt A |
13 peptides |
42 spectra |
|
0.000 0.000 | 0.000 |
0.000 0.000 | 0.000 |
0.000 0.000 | 0.000 |
0.000 0.000 | 0.000 |
0.000 0.000 | 0.000 |
0.351 0.344 | 0.356 |
0.617 0.611 | 0.622 |
0.032 0.028 | 0.036 |
| 4 spectra, GDSSIR | 0.000 | 0.000 | 0.008 | 0.000 | 0.000 | 0.277 | 0.715 | 0.000 | ||
| 4 spectra, DTICNQDER | 0.000 | 0.000 | 0.000 | 0.022 | 0.005 | 0.210 | 0.763 | 0.000 | ||
| 3 spectra, VTWDSSFCAVNPR | 0.000 | 0.000 | 0.093 | 0.145 | 0.000 | 0.028 | 0.580 | 0.153 | ||
| 3 spectra, AIFLADGNVFTTGFSR | 0.000 | 0.000 | 0.000 | 0.000 | 0.000 | 0.319 | 0.619 | 0.062 | ||
| 3 spectra, SDLICAPK | 0.000 | 0.000 | 0.000 | 0.000 | 0.042 | 0.284 | 0.674 | 0.000 | ||
| 3 spectra, VGIVAWHPTAR | 0.098 | 0.000 | 0.024 | 0.000 | 0.000 | 0.319 | 0.559 | 0.000 | ||
| 6 spectra, NDQCYDDIR | 0.000 | 0.000 | 0.000 | 0.067 | 0.000 | 0.275 | 0.574 | 0.084 | ||
| 2 spectra, HVFGQAVK | 0.000 | 0.000 | 0.007 | 0.000 | 0.000 | 0.410 | 0.573 | 0.010 | ||
| 4 spectra, QLALWNPK | 0.000 | 0.000 | 0.000 | 0.000 | 0.000 | 0.368 | 0.592 | 0.040 | ||
| 6 spectra, GMGYMPK | 0.000 | 0.000 | 0.000 | 0.000 | 0.000 | 0.462 | 0.538 | 0.000 | ||
| 1 spectrum, CEPIIMTVPR | 0.281 | 0.000 | 0.149 | 0.224 | 0.000 | 0.060 | 0.286 | 0.000 | ||
| 2 spectra, GLDVNK | 0.171 | 0.000 | 0.000 | 0.000 | 0.143 | 0.221 | 0.465 | 0.000 | ||
| 1 spectrum, HGYIPGK | 0.000 | 0.000 | 0.000 | 0.000 | 0.000 | 0.222 | 0.723 | 0.054 |
| Plot | Mito | Lyso or Perox | ER | Golgi | PM | Cytosol | Nucleus | ||||||
| Expt B |
4 peptides |
6 spectra |
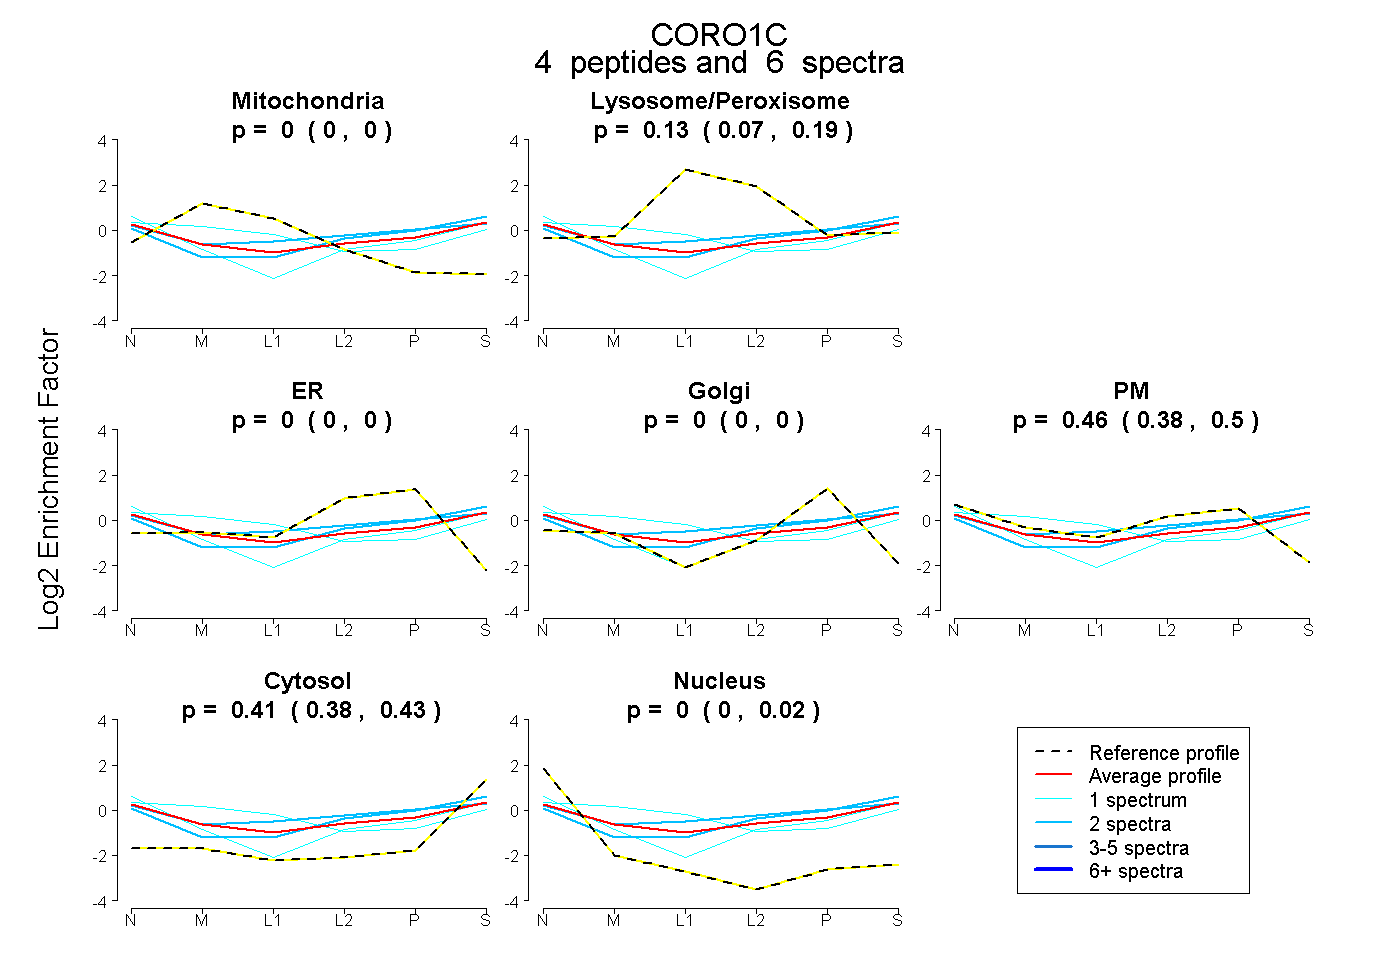 |
0.000 0.000 | 0.000 |
0.129 0.069 | 0.188 |
0.000 0.000 | 0.000 |
0.000 0.000 | 0.000 |
0.460 0.382 | 0.502 |
0.411 0.380 | 0.432 |
0.000 0.000 | 0.024 |
|||
| Plot | Lyso | Other | |||||||||||
| Expt C |
12 peptides |
44 spectra |
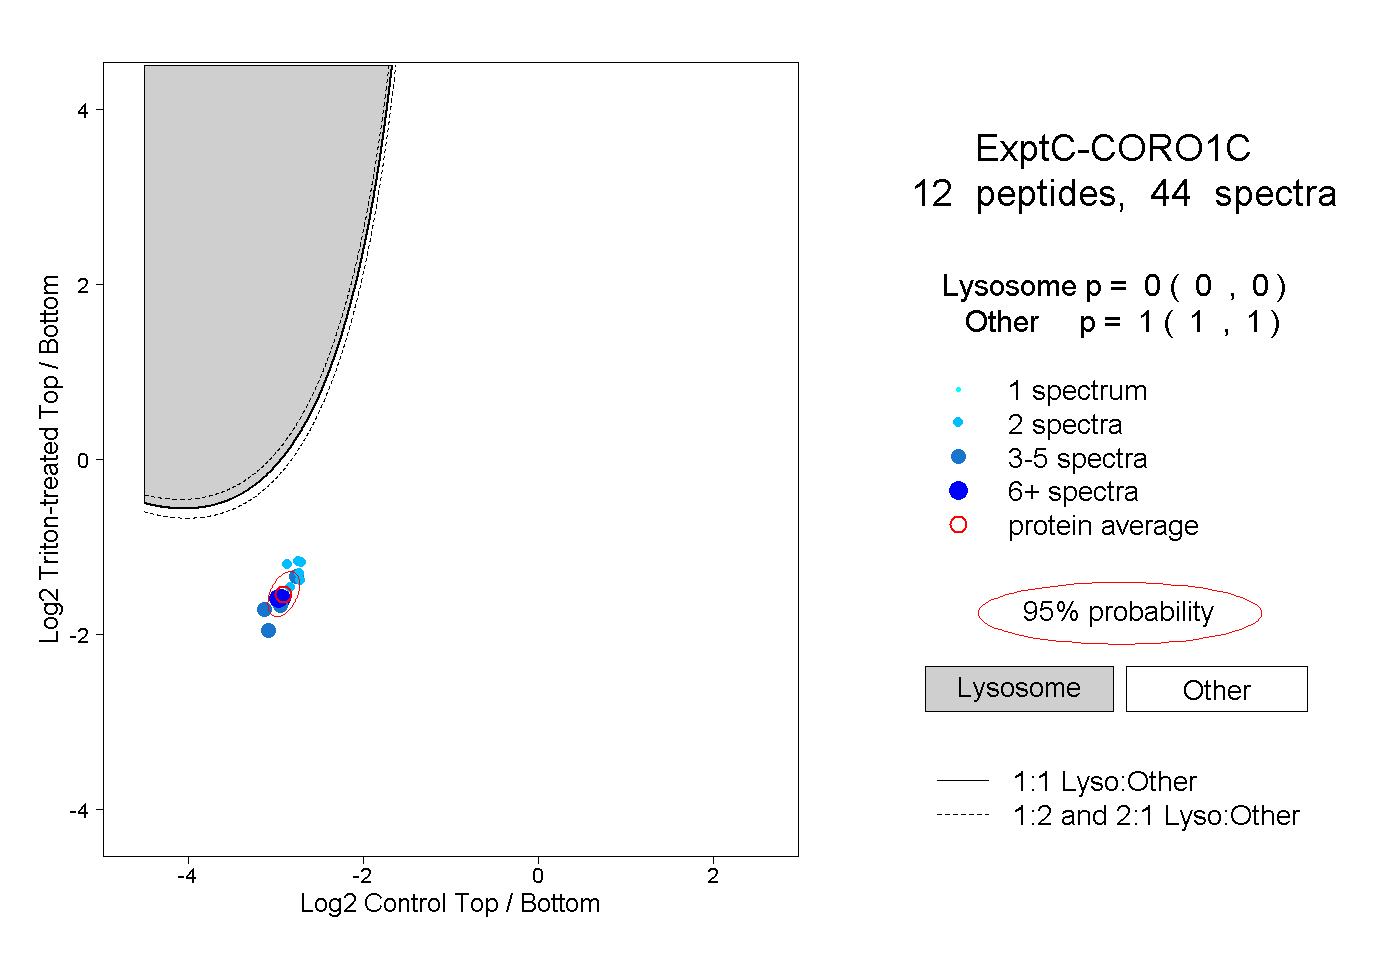 |
0.000 0.000 | 0.000 |
1.000 1.000 | 1.000 |
||||||||
| Plot | Lyso | Other | |||||||||||
| Expt D |
3 peptides |
5 spectra |
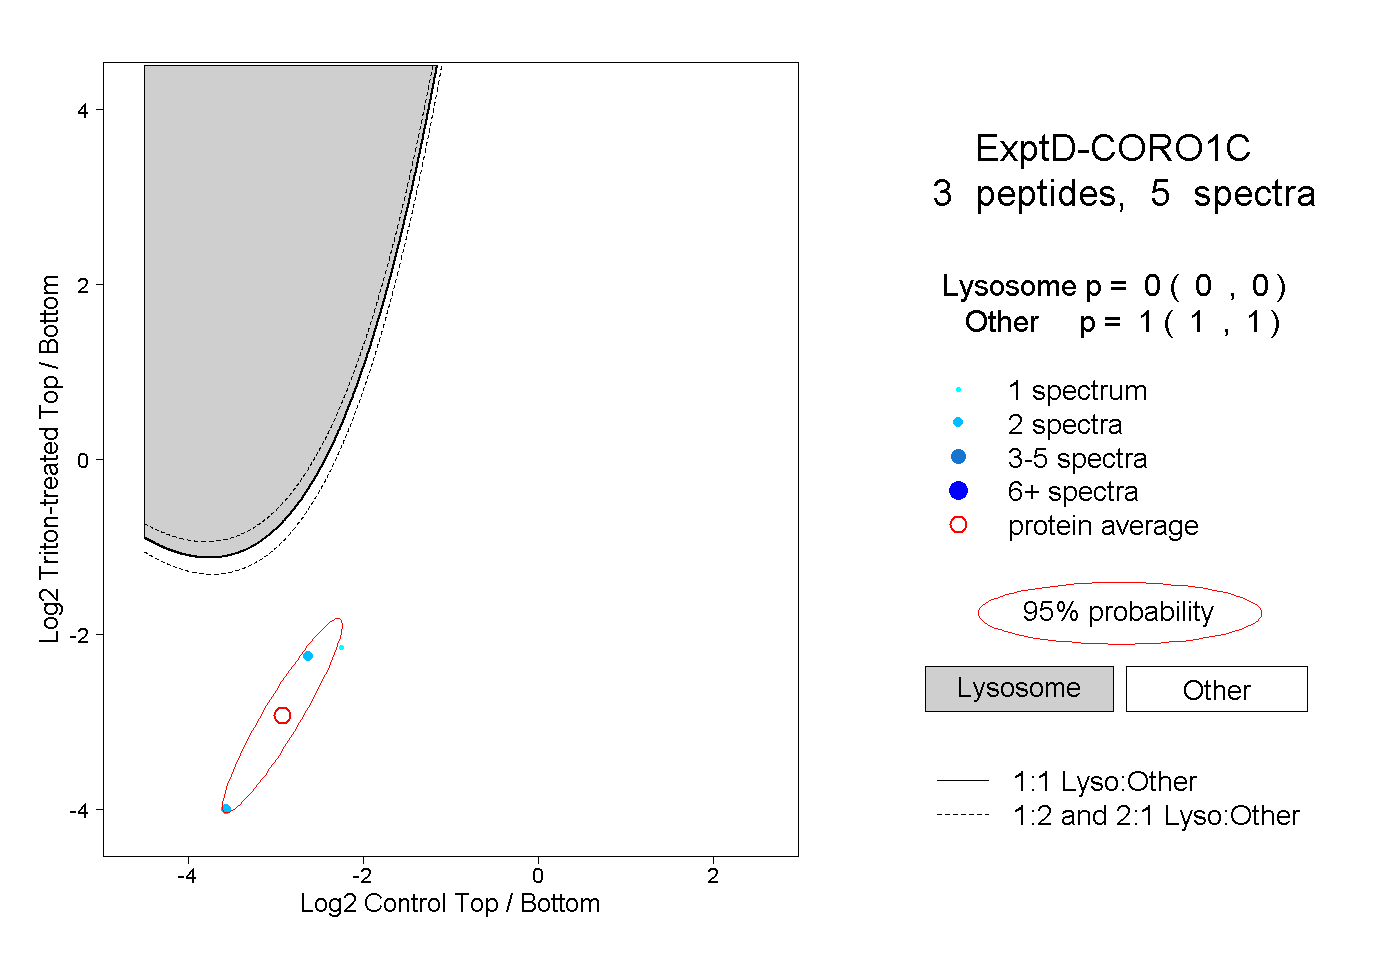 |
0.000 0.000 | 0.000 |
1.000 1.000 | 1.000 |