 20
20peptides
spectra
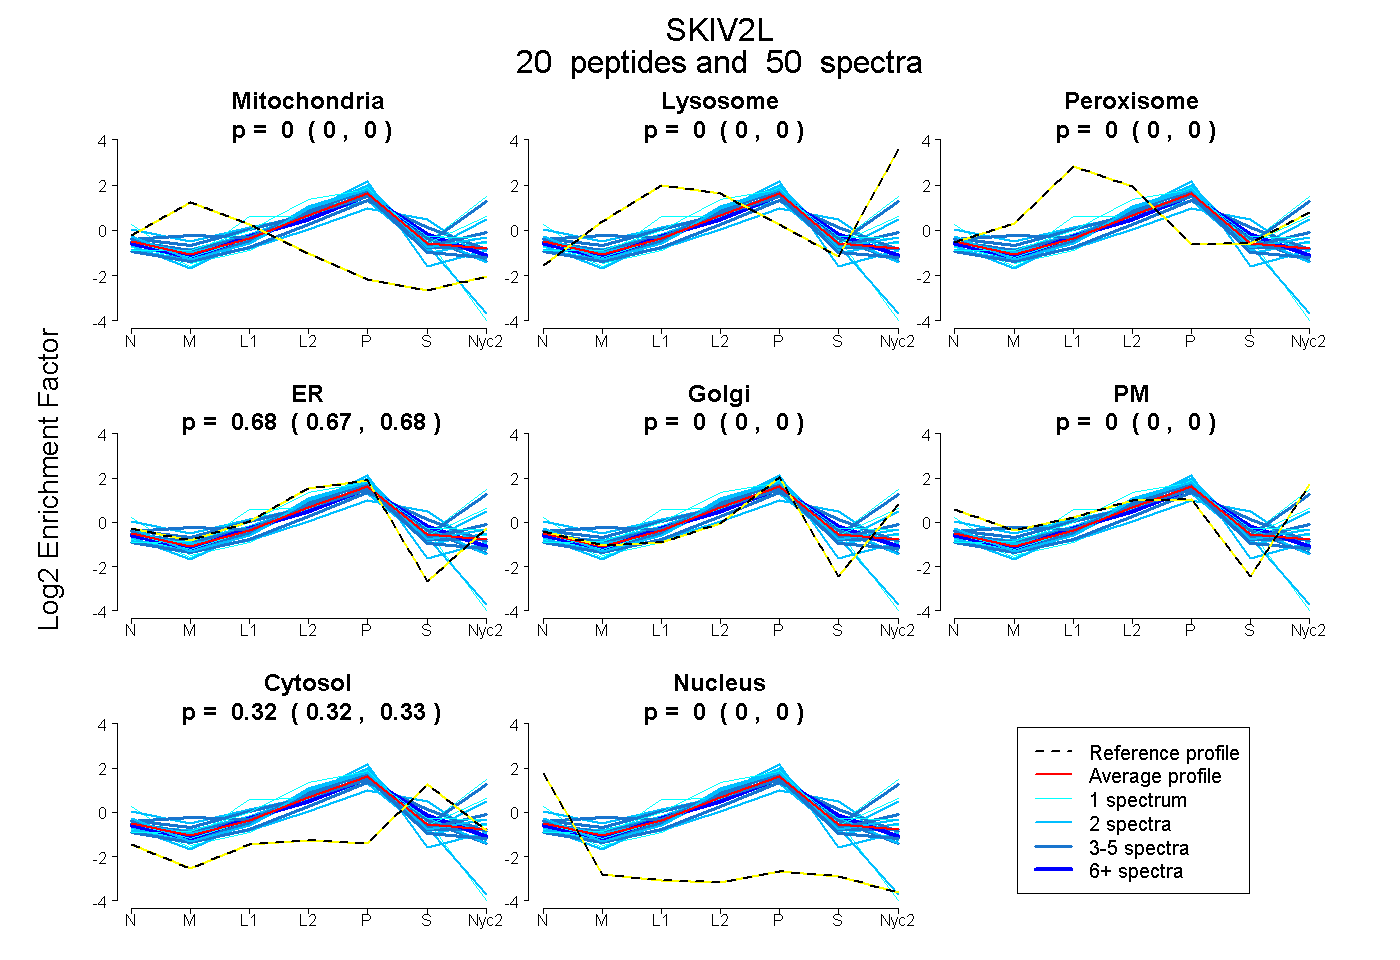
0.000 | 0.000
0.000 | 0.000
0.000 | 0.001
0.673 | 0.681
0.000 | 0.000
0.000 | 0.000
0.318 | 0.326
0.000 | 0.000
12peptides
spectra
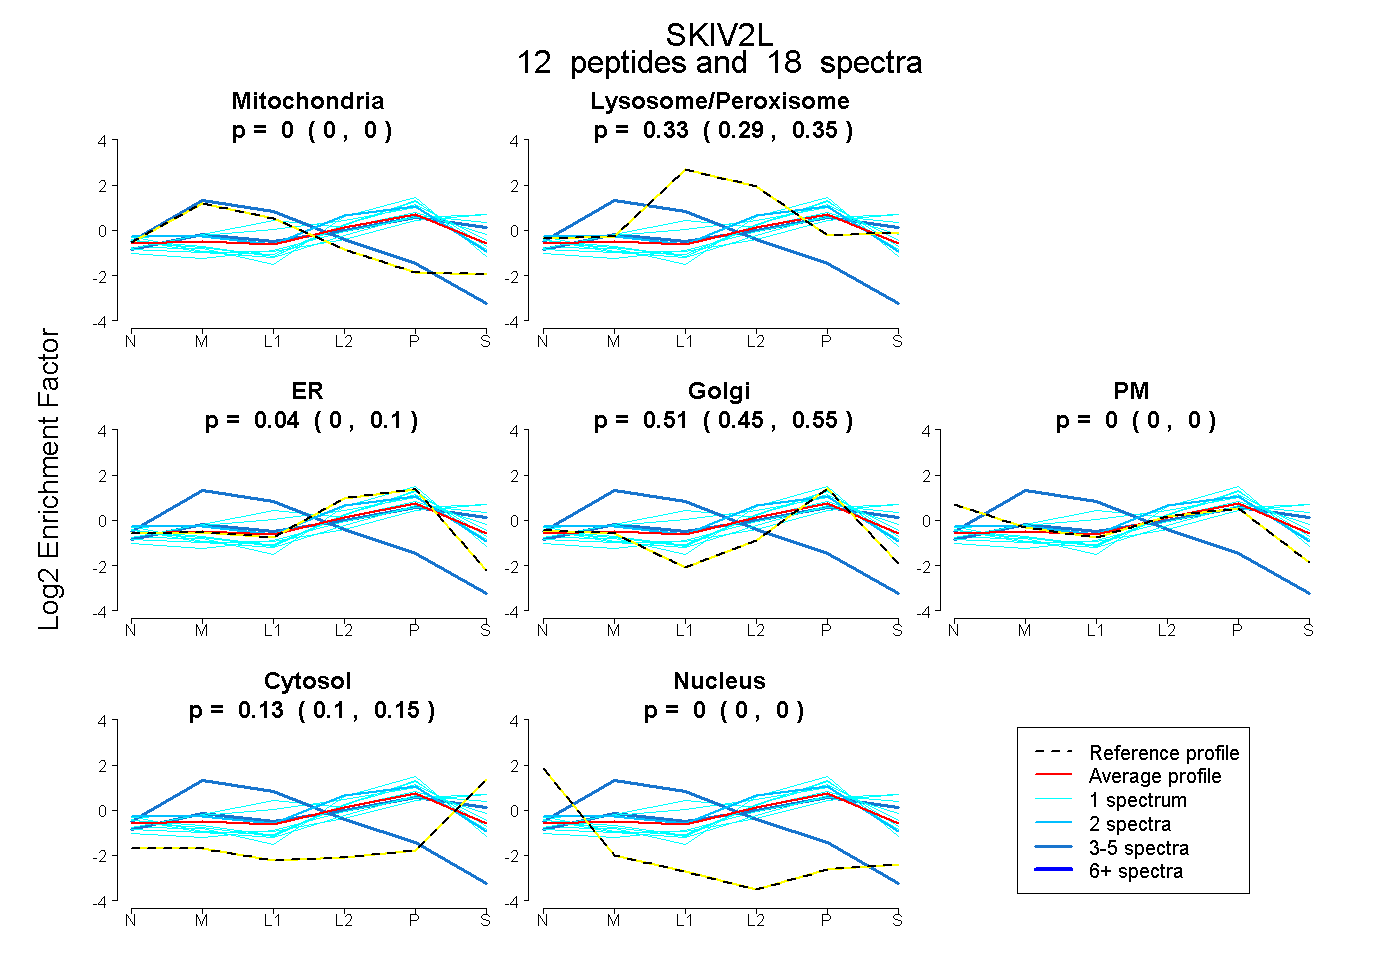
0.000 | 0.000
0.290 | 0.350
0.000 | 0.102
0.449 | 0.547
0.000 | 0.000
0.098 | 0.150
0.000 | 0.000
12peptides
spectra
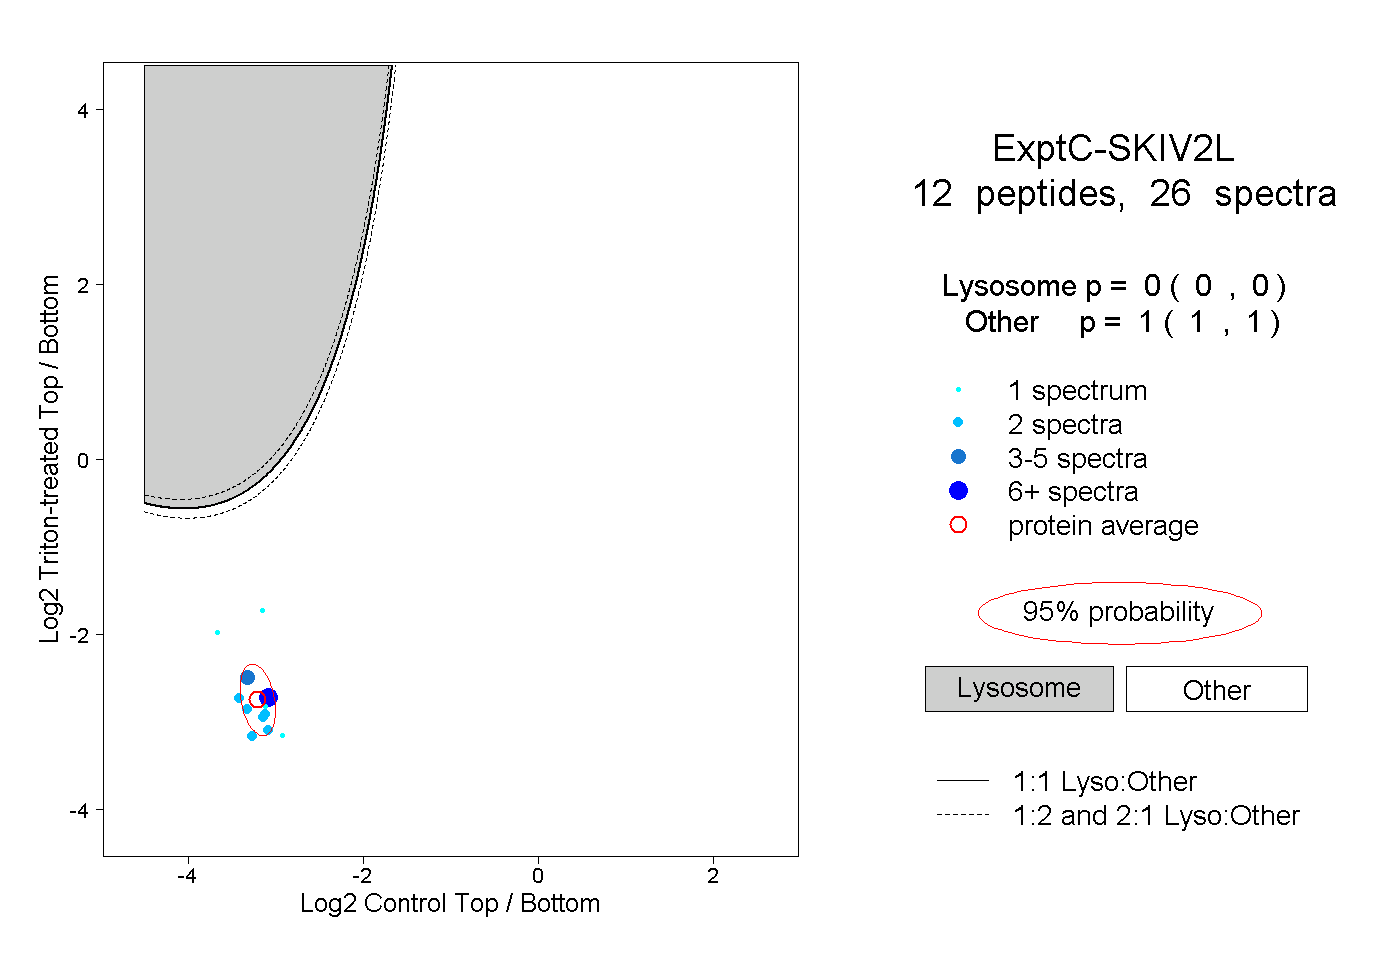
0.000 | 0.000
1.000 | 1.000
3peptides
spectra
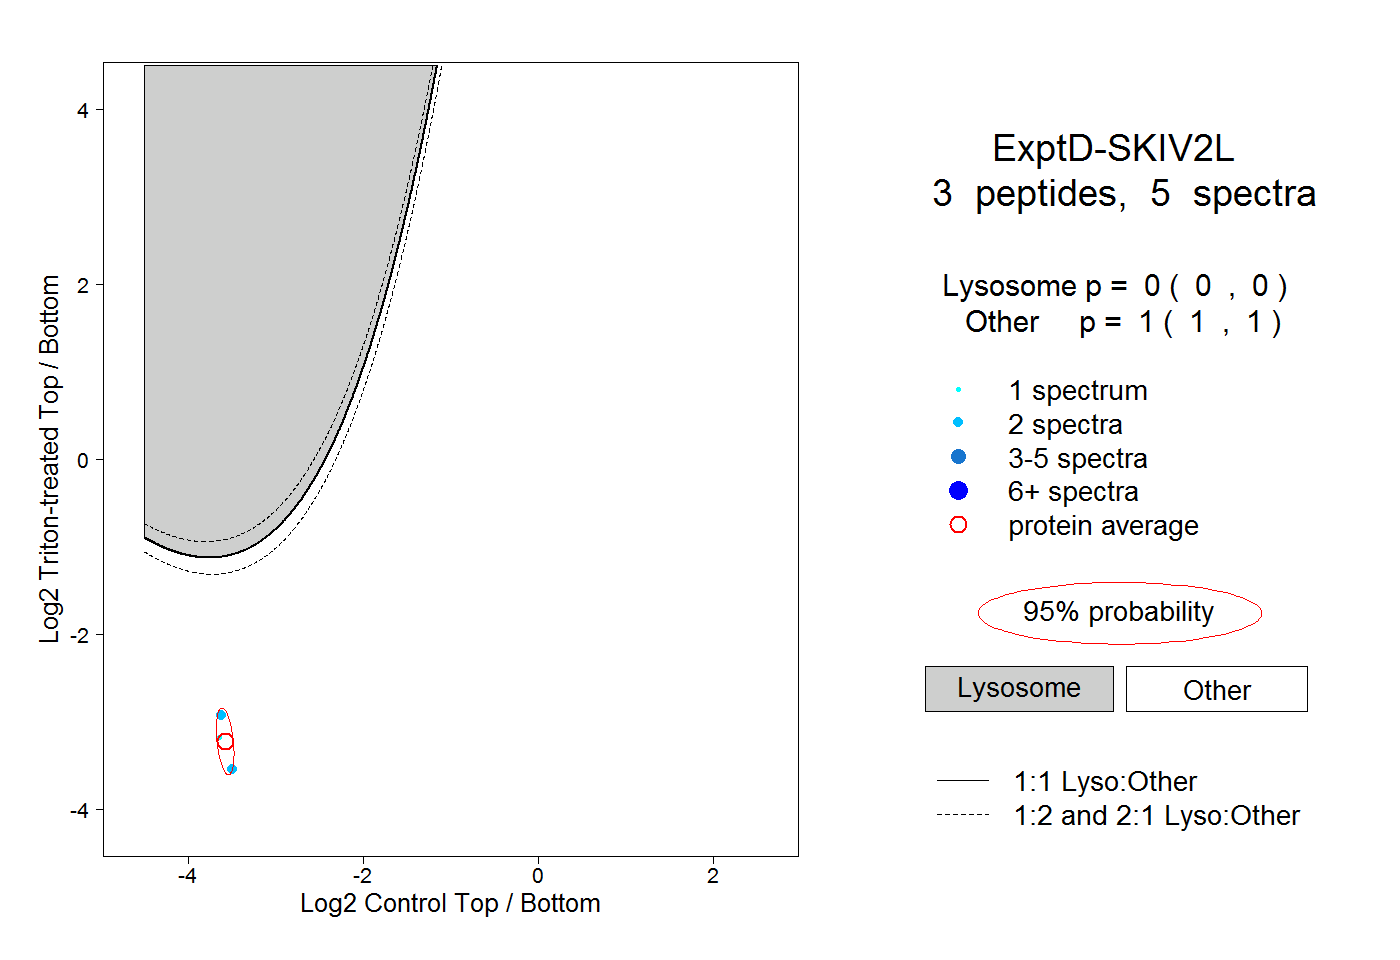
0.000 | 0.000
1.000 | 1.000