 20
20peptides
spectra
0.000 | 0.000
0.000 | 0.000
0.000 | 0.001
0.673 | 0.681
0.000 | 0.000
0.000 | 0.000
0.318 | 0.326
0.000 | 0.000
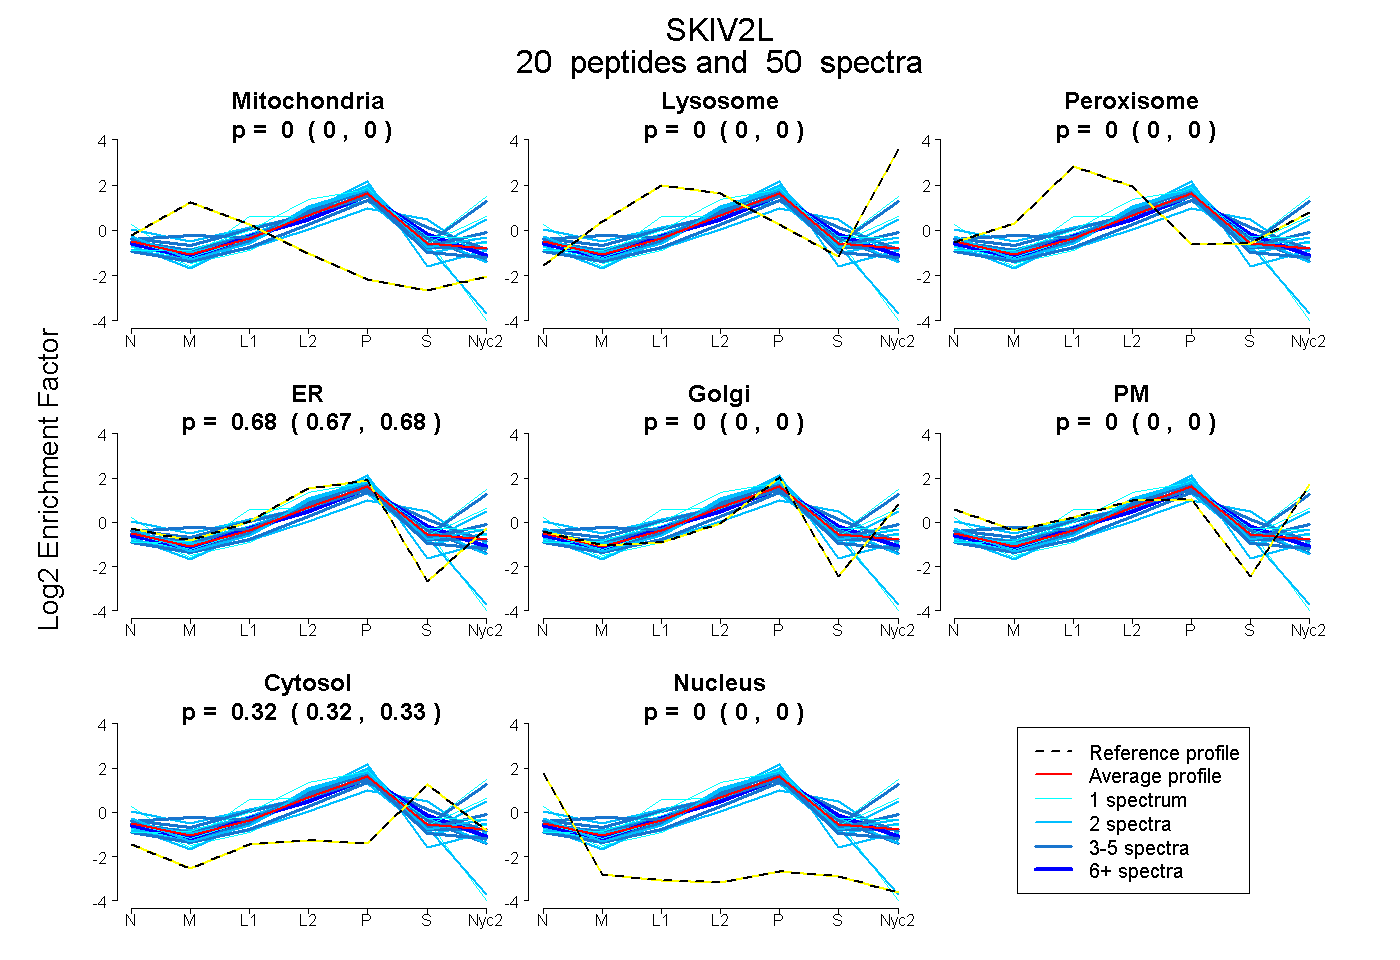
| Plot | Mito | Lyso | Perox | ER | Golgi | PM | Cytosol | Nucleus | |||||
| Expt A |
20 peptides |
50 spectra |
|
0.000 0.000 | 0.000 |
0.000 0.000 | 0.000 |
0.000 0.000 | 0.001 |
0.678 0.673 | 0.681 |
0.000 0.000 | 0.000 |
0.000 0.000 | 0.000 |
0.322 0.318 | 0.326 |
0.000 0.000 | 0.000 |
| 4 spectra, DVAVVEGGLR | 0.000 | 0.000 | 0.000 | 0.640 | 0.000 | 0.000 | 0.360 | 0.000 | ||
| 2 spectra, LAEMCR | 0.000 | 0.000 | 0.000 | 0.630 | 0.000 | 0.000 | 0.370 | 0.000 | ||
| 3 spectra, TLGYVDEAGTVK | 0.080 | 0.000 | 0.006 | 0.699 | 0.000 | 0.000 | 0.215 | 0.000 | ||
| 1 spectrum, TVVAEYAIALAQK | 0.000 | 0.229 | 0.000 | 0.539 | 0.041 | 0.000 | 0.191 | 0.000 | ||
| 1 spectrum, DLEWVIFDEVHYINDAER | 0.000 | 0.000 | 0.000 | 0.666 | 0.008 | 0.000 | 0.326 | 0.000 | ||
| 2 spectra, EIVEMLFSR | 0.000 | 0.000 | 0.000 | 0.767 | 0.007 | 0.000 | 0.226 | 0.000 | ||
| 2 spectra, TVVFDSMR | 0.000 | 0.000 | 0.000 | 0.670 | 0.068 | 0.000 | 0.262 | 0.000 | ||
| 2 spectra, GLDPTGTVILLCK | 0.000 | 0.000 | 0.000 | 0.642 | 0.000 | 0.000 | 0.255 | 0.103 | ||
| 7 spectra, SEIHLFLQR | 0.000 | 0.000 | 0.001 | 0.609 | 0.000 | 0.000 | 0.390 | 0.000 | ||
| 2 spectra, METAATLLR | 0.000 | 0.000 | 0.000 | 0.750 | 0.077 | 0.000 | 0.173 | 0.000 | ||
| 1 spectrum, ALSNQK | 0.000 | 0.000 | 0.000 | 0.511 | 0.000 | 0.000 | 0.249 | 0.240 | ||
| 2 spectra, FPAQYVK | 0.000 | 0.000 | 0.248 | 0.126 | 0.374 | 0.127 | 0.125 | 0.000 | ||
| 2 spectra, GAFHTK | 0.000 | 0.000 | 0.000 | 0.443 | 0.000 | 0.000 | 0.557 | 0.000 | ||
| 2 spectra, DLLPGEYVQMAGR | 0.000 | 0.000 | 0.000 | 0.749 | 0.000 | 0.000 | 0.251 | 0.000 | ||
| 3 spectra, QPTHQGGPAQDR | 0.000 | 0.000 | 0.000 | 0.712 | 0.000 | 0.000 | 0.288 | 0.000 | ||
| 4 spectra, SMLYSGSDVIR | 0.000 | 0.000 | 0.183 | 0.382 | 0.243 | 0.000 | 0.193 | 0.000 | ||
| 4 spectra, ISEDFSK | 0.000 | 0.000 | 0.000 | 0.519 | 0.000 | 0.000 | 0.481 | 0.000 | ||
| 4 spectra, GYYAAVEAK | 0.000 | 0.261 | 0.000 | 0.067 | 0.499 | 0.000 | 0.173 | 0.000 | ||
| 1 spectrum, TIYTSPIK | 0.000 | 0.000 | 0.047 | 0.535 | 0.091 | 0.000 | 0.327 | 0.000 | ||
| 1 spectrum, GDAASASPSSTPLIR | 0.000 | 0.352 | 0.007 | 0.114 | 0.379 | 0.000 | 0.148 | 0.000 |
| Plot | Mito | Lyso or Perox | ER | Golgi | PM | Cytosol | Nucleus | ||||||
| Expt B |
12 peptides |
18 spectra |
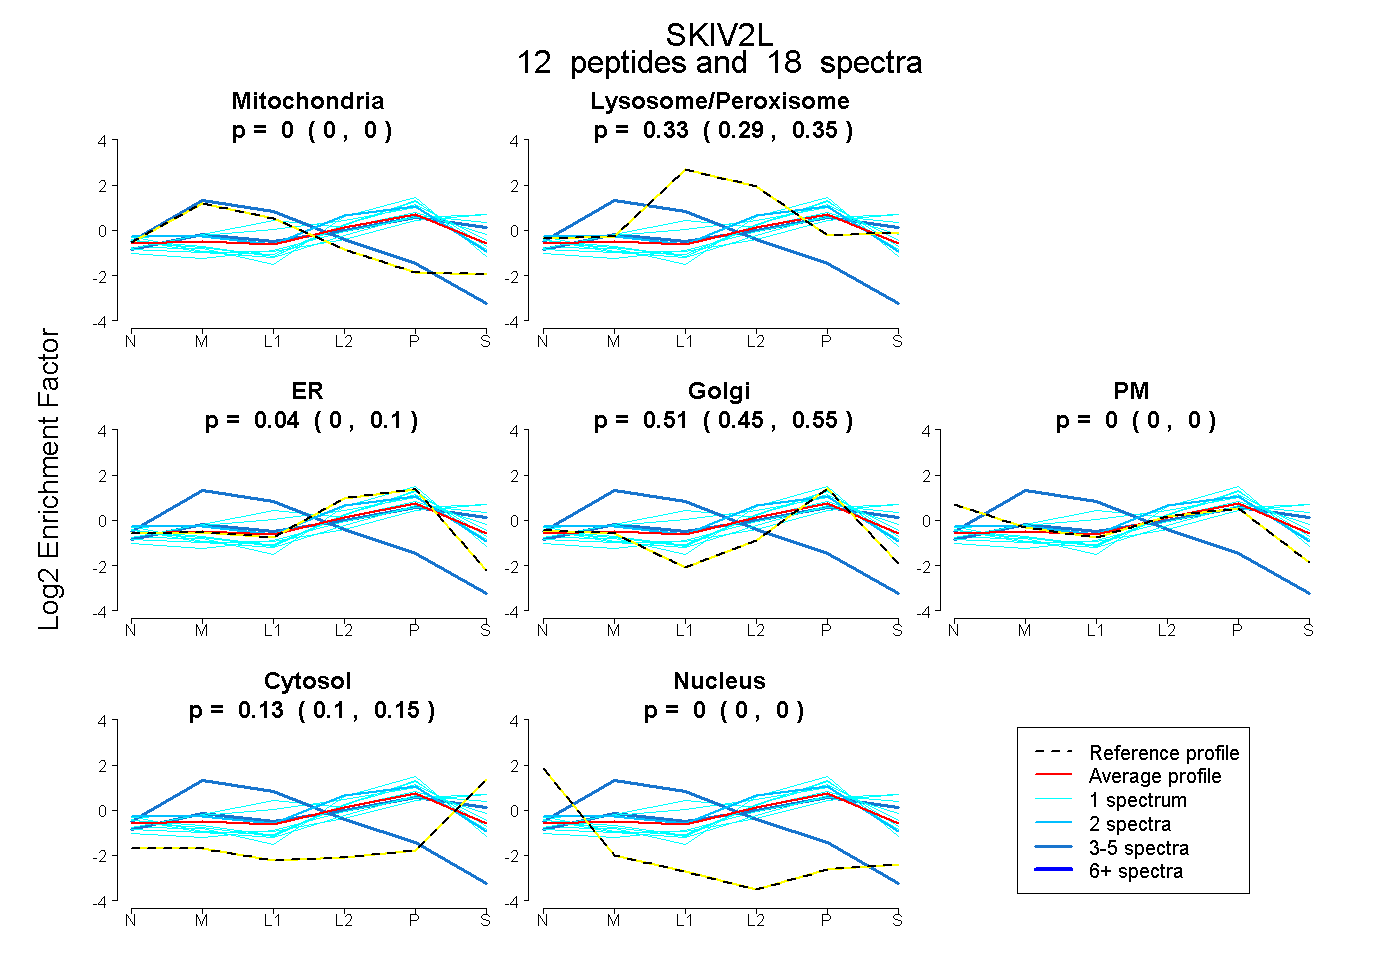 |
0.000 0.000 | 0.000 |
0.325 0.290 | 0.350 |
0.041 0.000 | 0.102 |
0.508 0.449 | 0.547 |
0.000 0.000 | 0.000 |
0.126 0.098 | 0.150 |
0.000 0.000 | 0.000 |
|||
| Plot | Lyso | Other | |||||||||||
| Expt C |
12 peptides |
26 spectra |
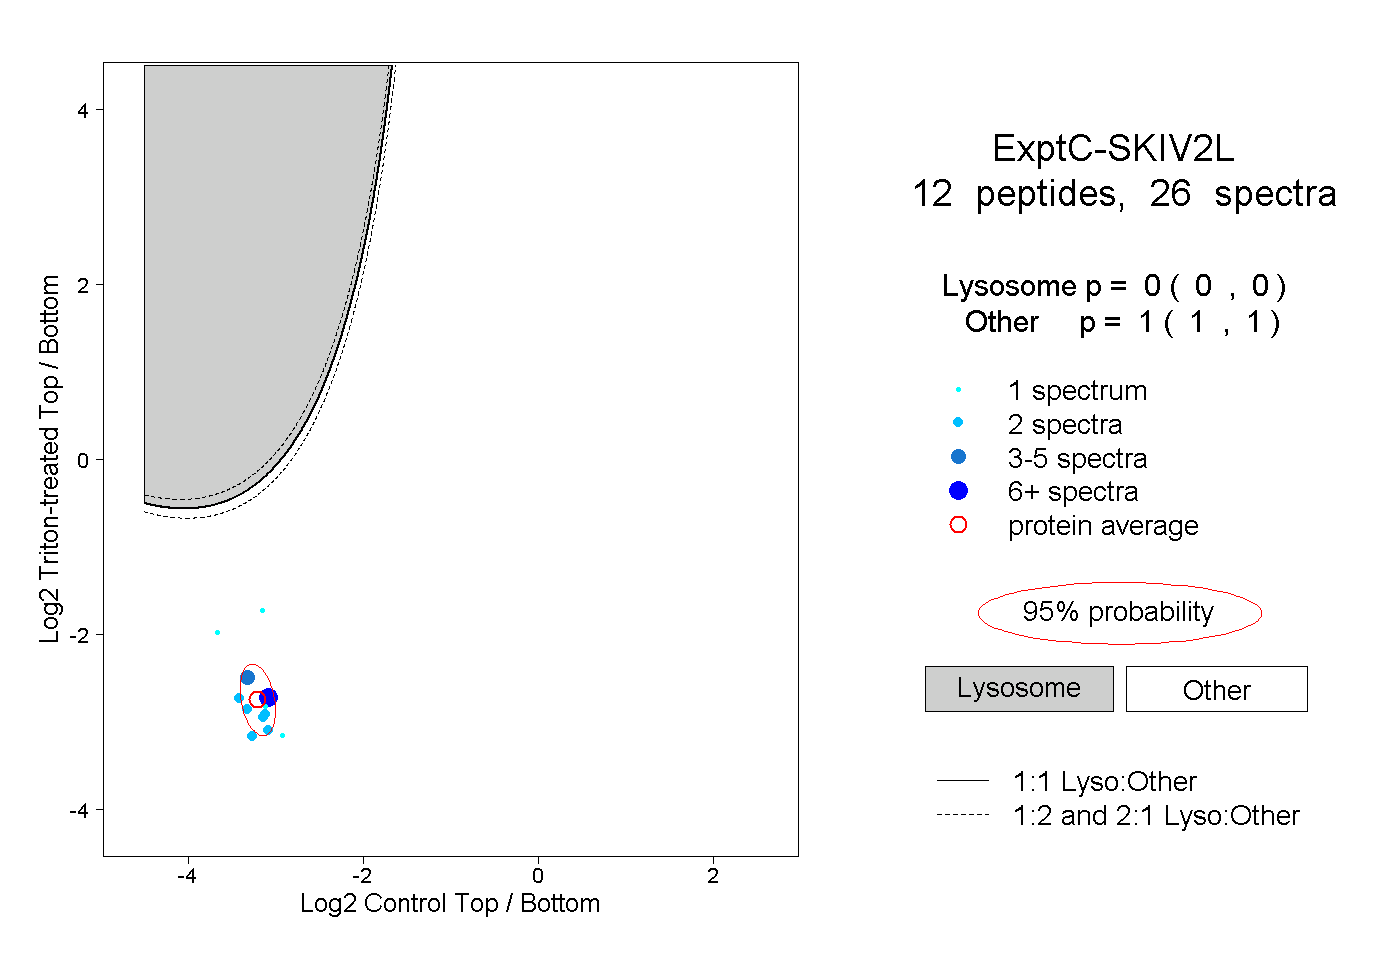 |
0.000 0.000 | 0.000 |
1.000 1.000 | 1.000 |
||||||||
| Plot | Lyso | Other | |||||||||||
| Expt D |
3 peptides |
5 spectra |
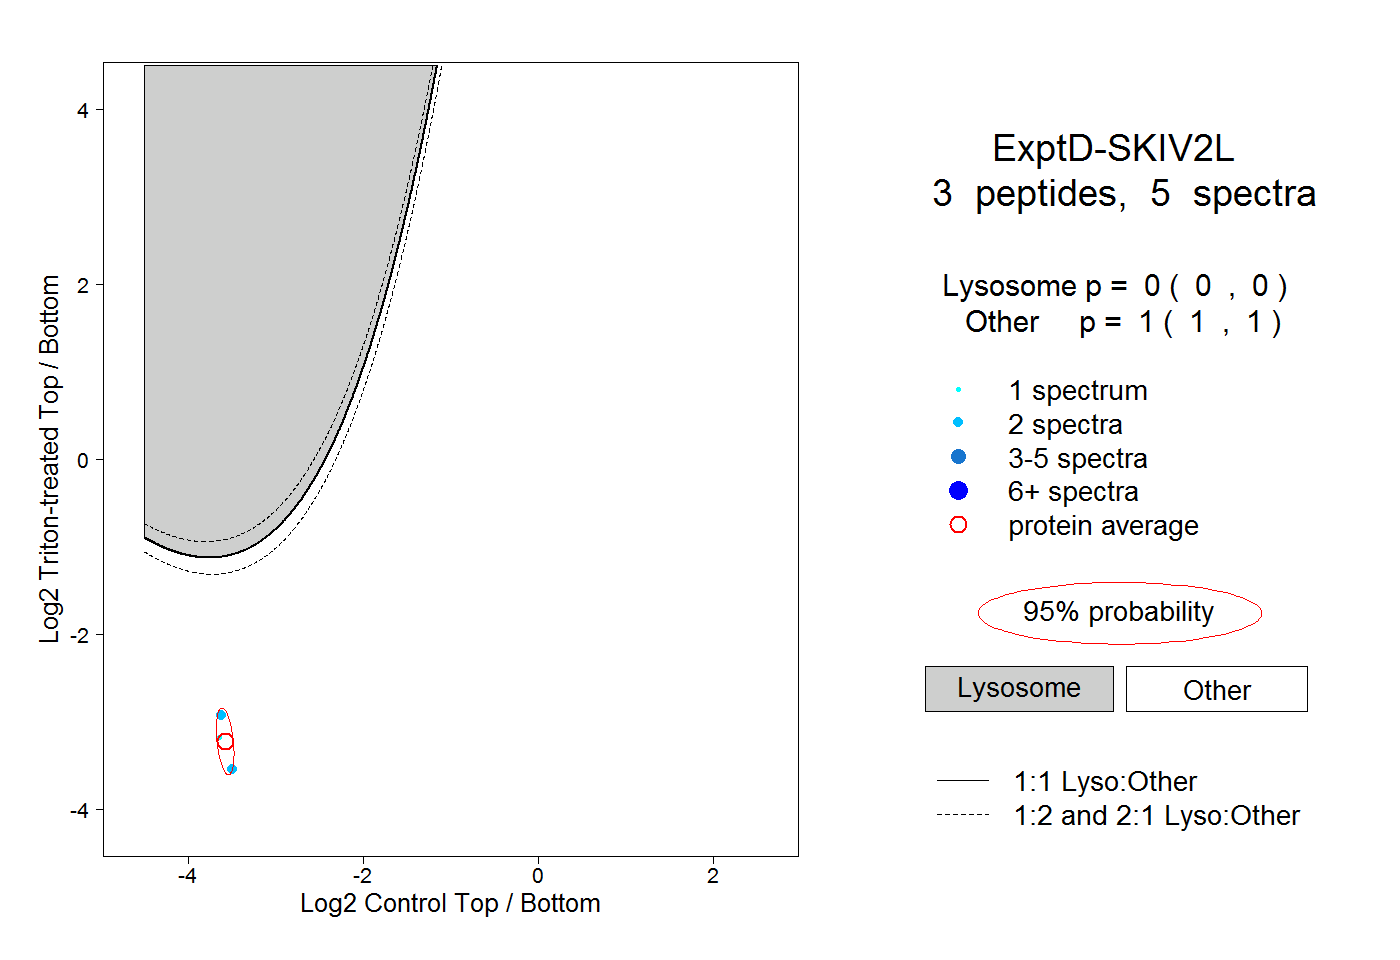 |
0.000 0.000 | 0.000 |
1.000 1.000 | 1.000 |