 10
10peptides
spectra
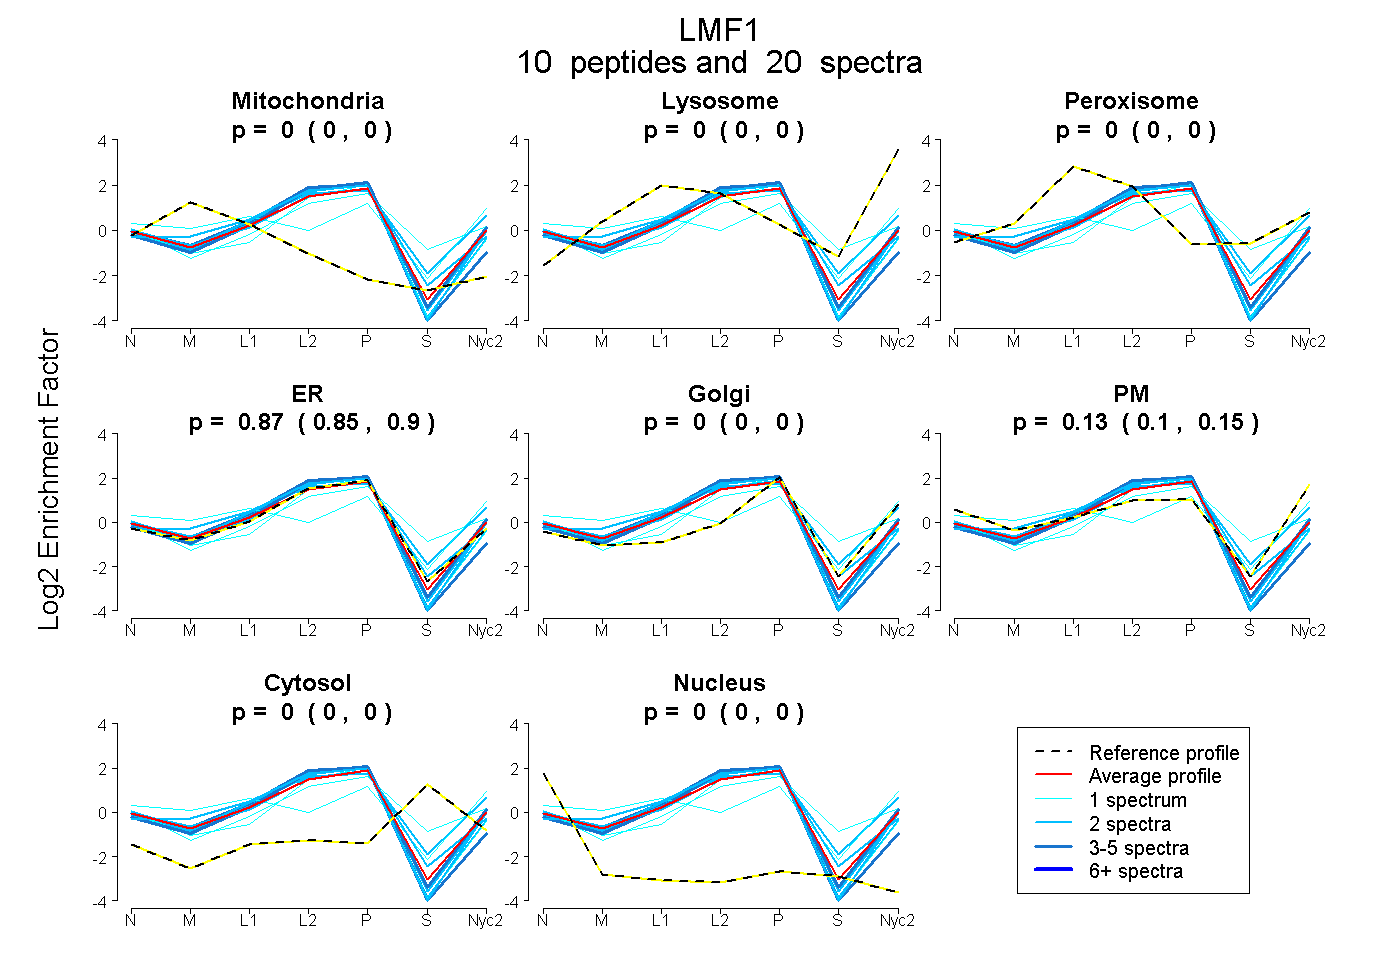
0.000 | 0.001
0.000 | 0.000
0.000 | 0.000
0.847 | 0.897
0.000 | 0.000
0.098 | 0.148
0.000 | 0.000
0.000 | 0.000
3peptides
spectra
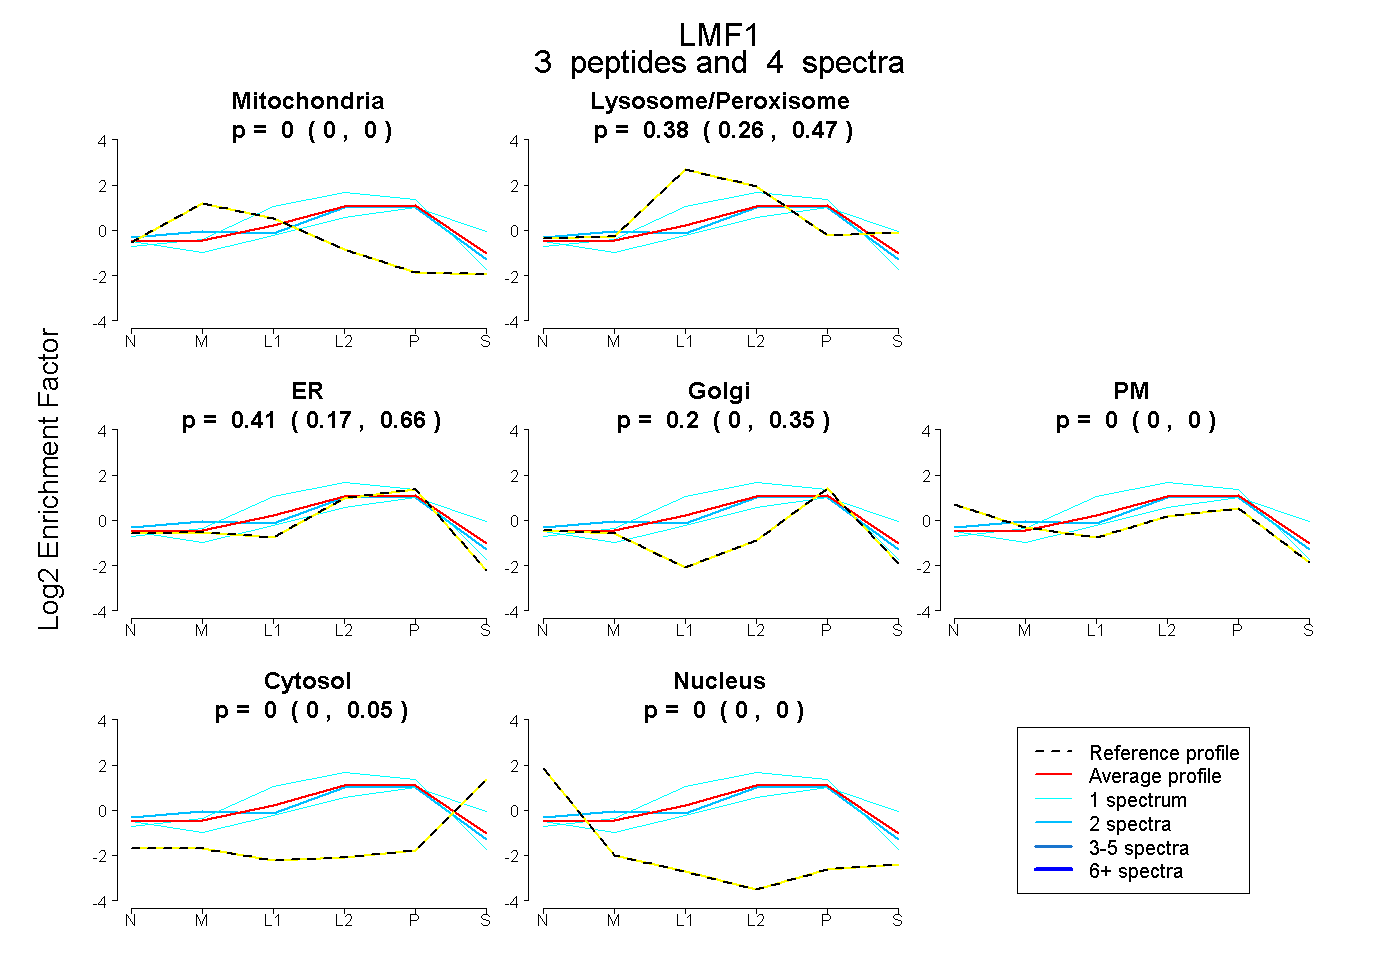
0.000 | 0.000
0.257 | 0.471
0.173 | 0.658
0.000 | 0.347
0.000 | 0.000
0.000 | 0.054
0.000 | 0.000
6peptides
spectra
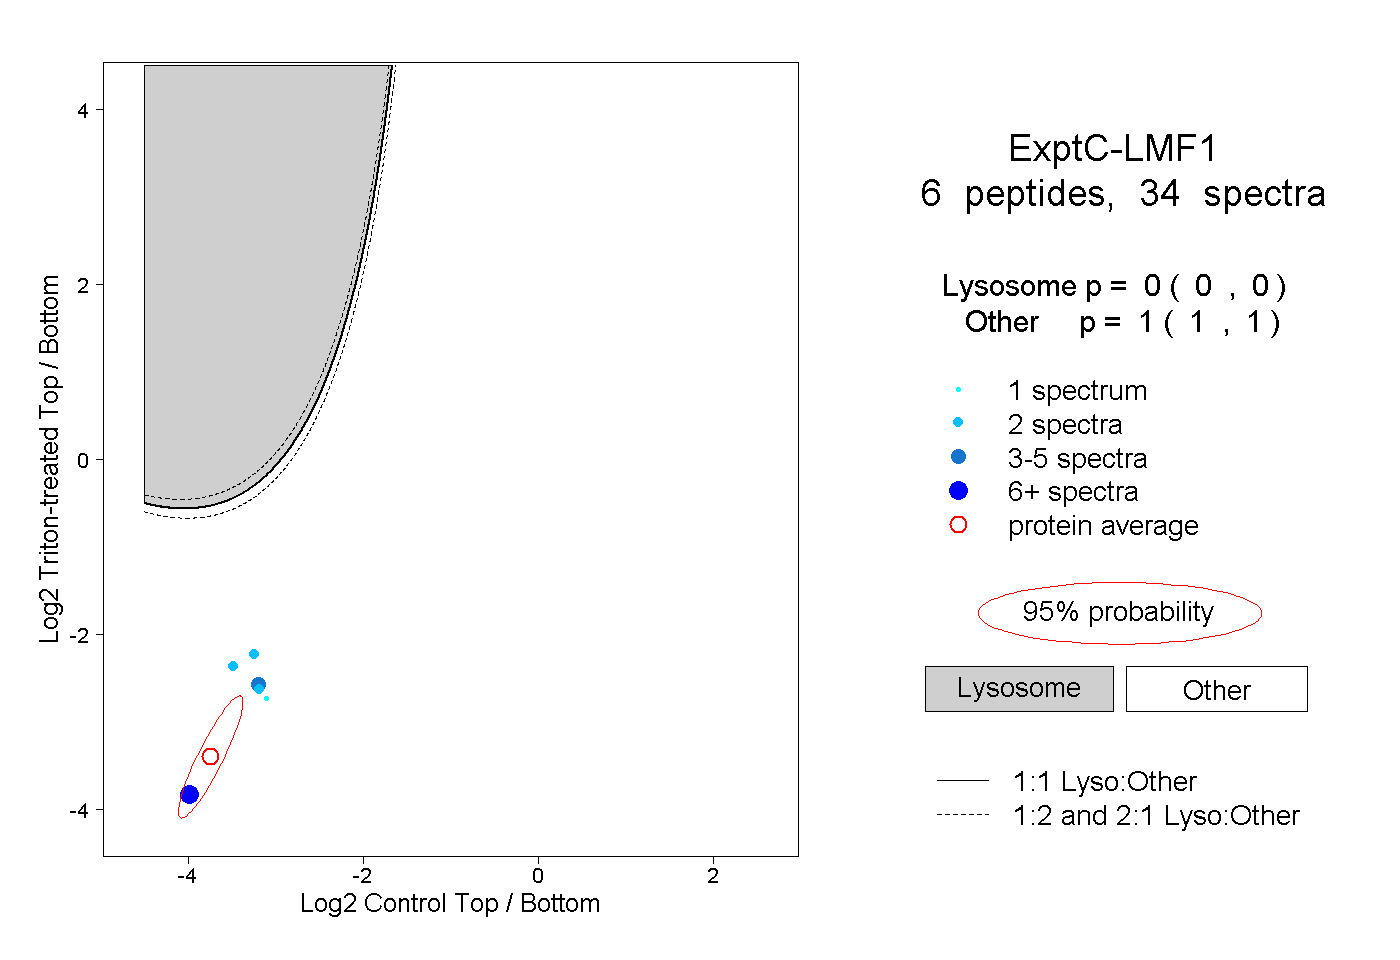
0.000 | 0.000
1.000 | 1.000
2peptides
spectra
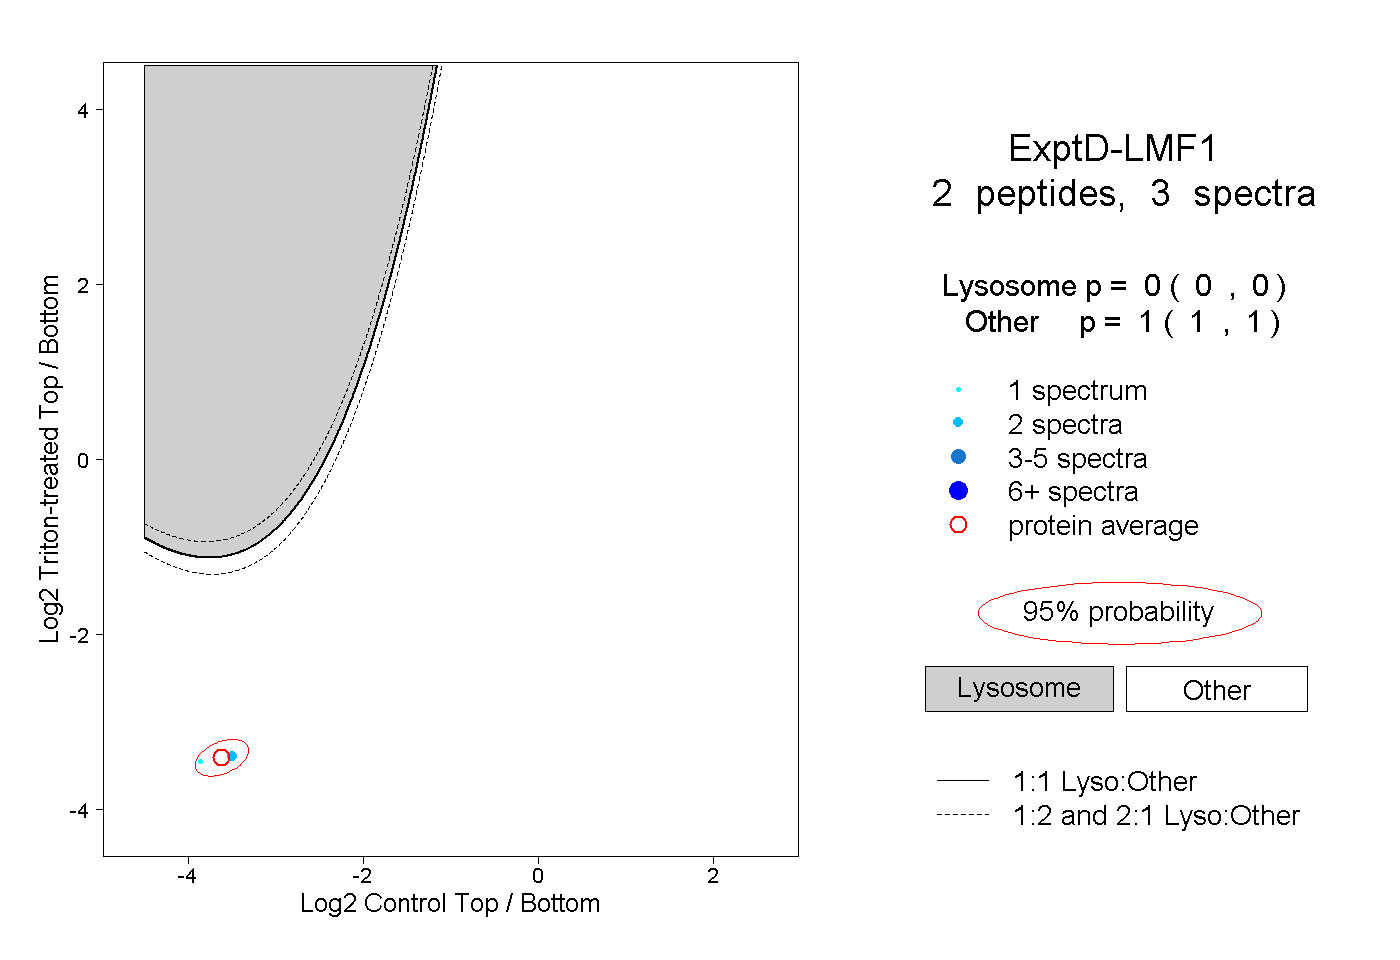
0.000 | 0.000
1.000 | 1.000