 10
10peptides
spectra
0.000 | 0.001
0.000 | 0.000
0.000 | 0.000
0.847 | 0.897
0.000 | 0.000
0.098 | 0.148
0.000 | 0.000
0.000 | 0.000
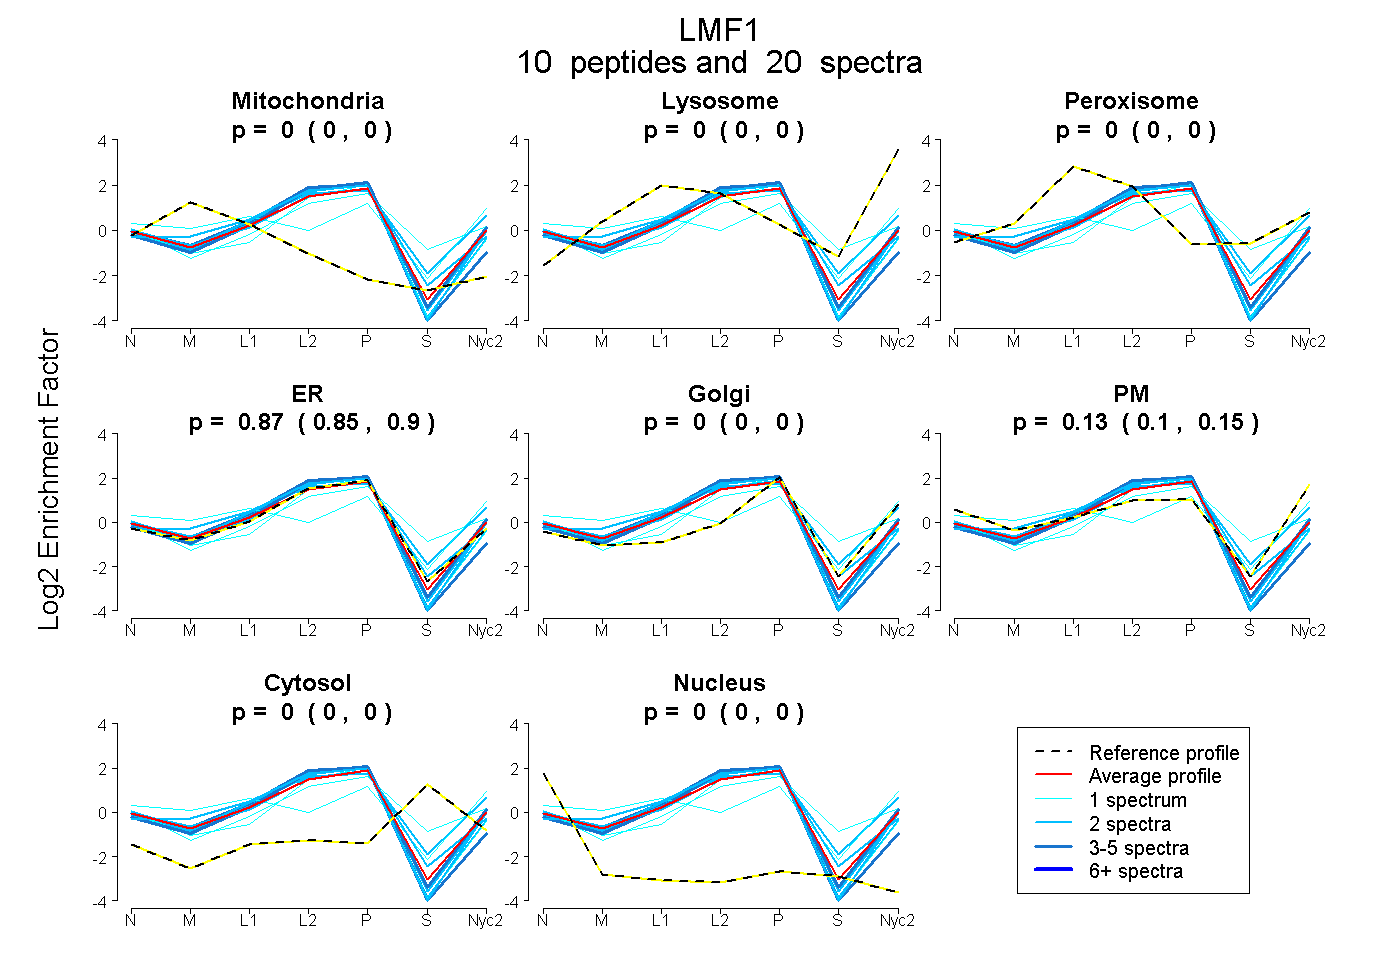
| Plot | Mito | Lyso | Perox | ER | Golgi | PM | Cytosol | Nucleus | |||||
| Expt A |
10 peptides |
20 spectra |
|
0.000 0.000 | 0.001 |
0.000 0.000 | 0.000 |
0.000 0.000 | 0.000 |
0.874 0.847 | 0.897 |
0.000 0.000 | 0.000 |
0.126 0.098 | 0.148 |
0.000 0.000 | 0.000 |
0.000 0.000 | 0.000 |
| 3 spectra, QVMNTSFNPLR | 0.000 | 0.000 | 0.000 | 0.942 | 0.000 | 0.058 | 0.000 | 0.000 | ||
| 1 spectrum, IMLGAGLIK | 0.000 | 0.000 | 0.033 | 0.559 | 0.000 | 0.192 | 0.215 | 0.000 | ||
| 4 spectra, GLLPCR | 0.006 | 0.000 | 0.000 | 0.994 | 0.000 | 0.000 | 0.000 | 0.000 | ||
| 2 spectra, ALIGDR | 0.000 | 0.000 | 0.000 | 1.000 | 0.000 | 0.000 | 0.000 | 0.000 | ||
| 1 spectrum, VGGAEHSPASPSALTR | 0.117 | 0.008 | 0.110 | 0.000 | 0.287 | 0.477 | 0.000 | 0.000 | ||
| 2 spectra, EWPLPEPPSR | 0.000 | 0.000 | 0.000 | 0.976 | 0.000 | 0.024 | 0.000 | 0.000 | ||
| 2 spectra, VLEMQR | 0.000 | 0.000 | 0.000 | 0.944 | 0.000 | 0.056 | 0.000 | 0.000 | ||
| 2 spectra, IVNTYGAFGSITK | 0.000 | 0.085 | 0.055 | 0.621 | 0.000 | 0.230 | 0.009 | 0.000 | ||
| 2 spectra, YLGCVVR | 0.000 | 0.000 | 0.033 | 0.938 | 0.000 | 0.025 | 0.000 | 0.004 | ||
| 1 spectrum, IGPYFPPLCLEDLK | 0.000 | 0.000 | 0.000 | 0.953 | 0.000 | 0.000 | 0.000 | 0.047 |
| Plot | Mito | Lyso or Perox | ER | Golgi | PM | Cytosol | Nucleus | ||||||
| Expt B |
3 peptides |
4 spectra |
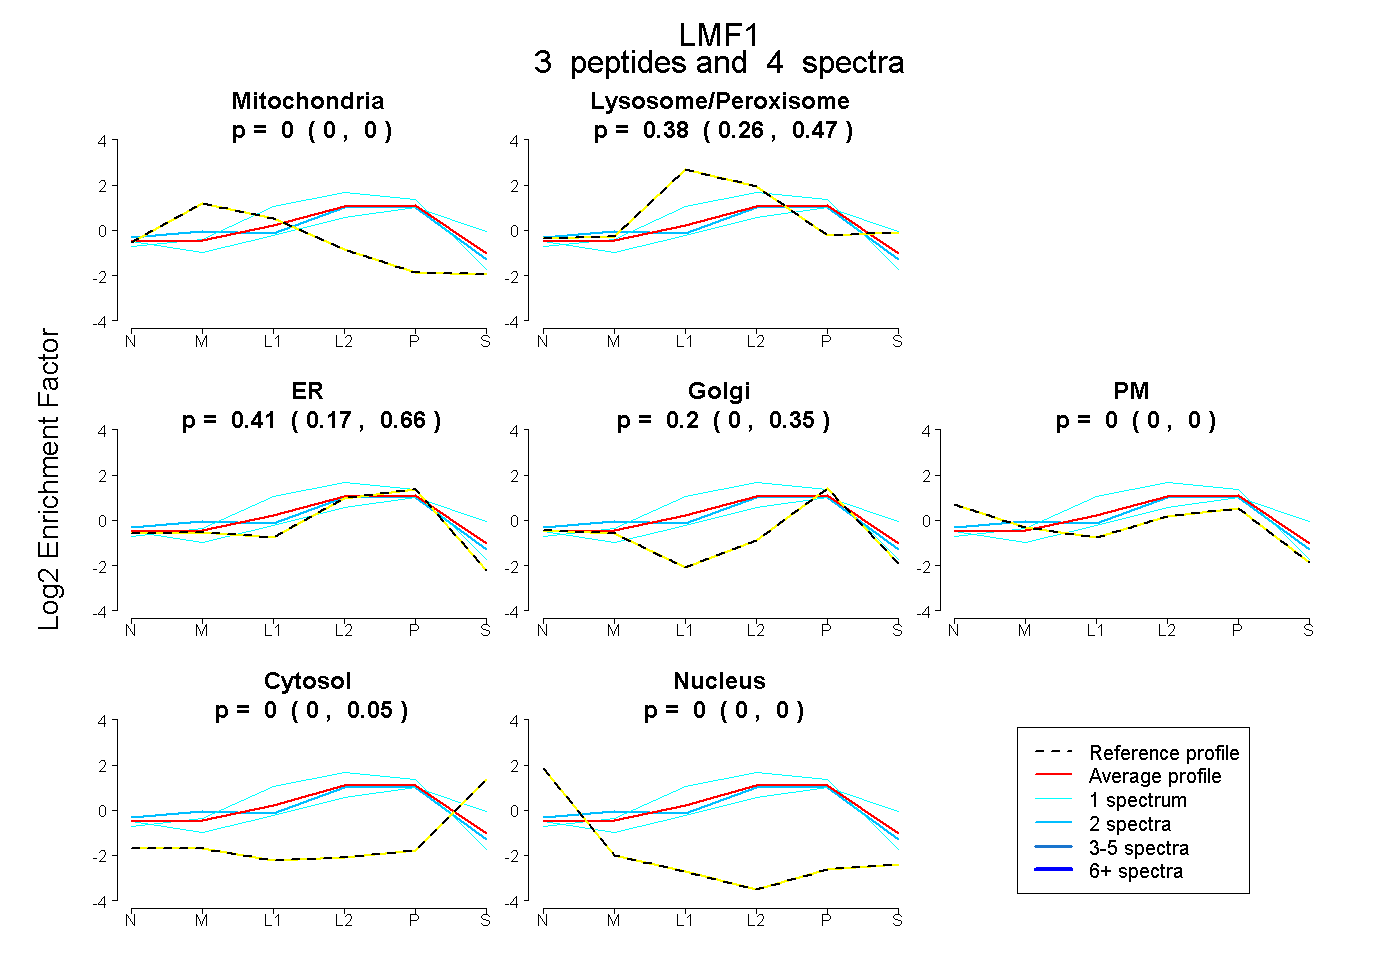 |
0.000 0.000 | 0.000 |
0.382 0.257 | 0.471 |
0.414 0.173 | 0.658 |
0.203 0.000 | 0.347 |
0.000 0.000 | 0.000 |
0.000 0.000 | 0.054 |
0.000 0.000 | 0.000 |
|||
| Plot | Lyso | Other | |||||||||||
| Expt C |
6 peptides |
34 spectra |
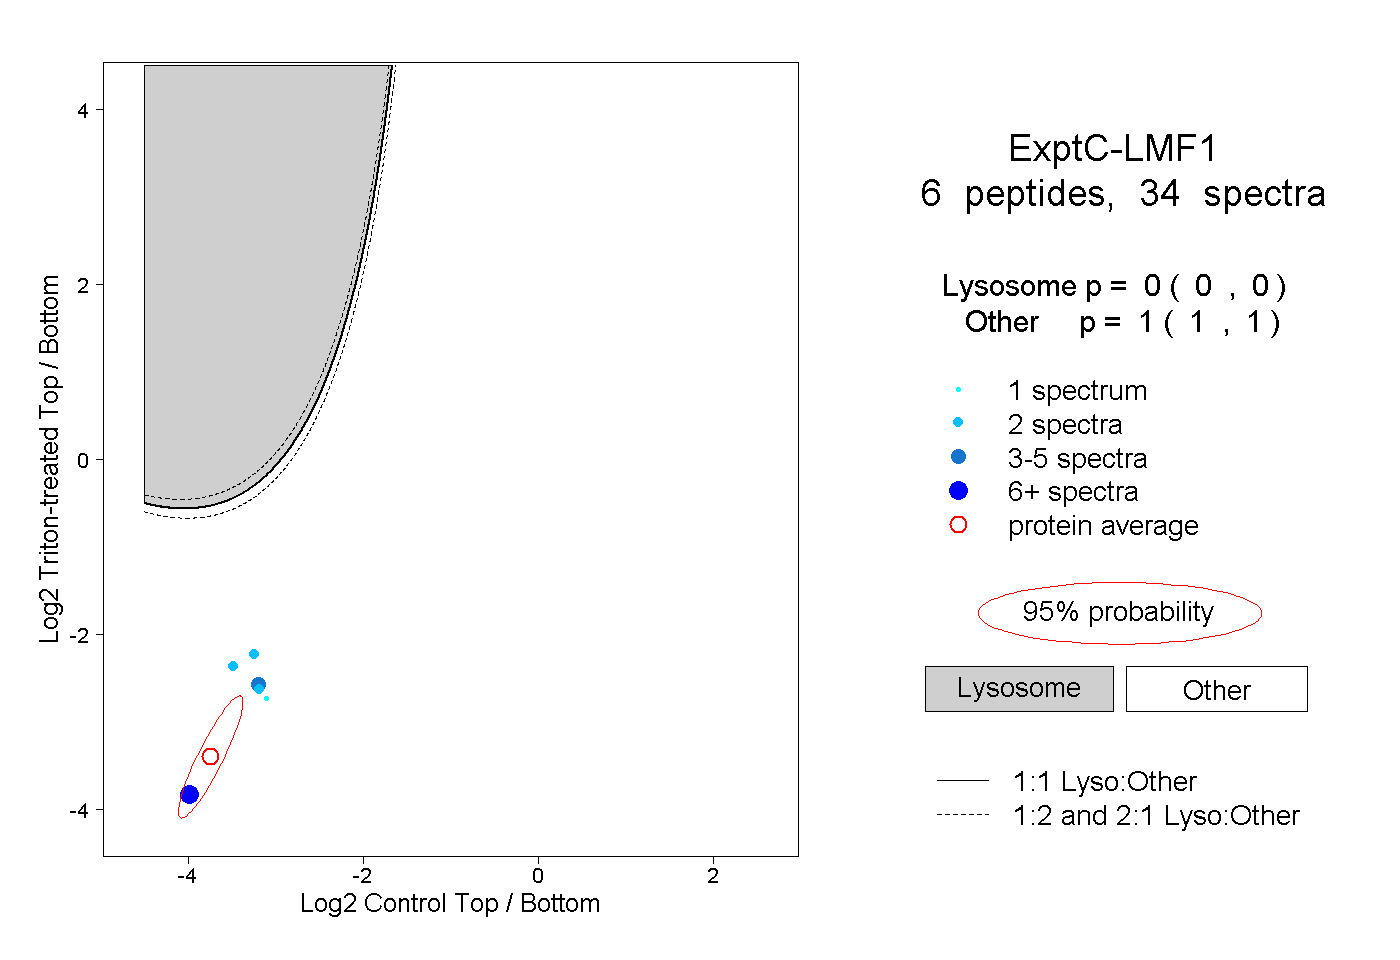 |
0.000 0.000 | 0.000 |
1.000 1.000 | 1.000 |
||||||||
| Plot | Lyso | Other | |||||||||||
| Expt D |
2 peptides |
3 spectra |
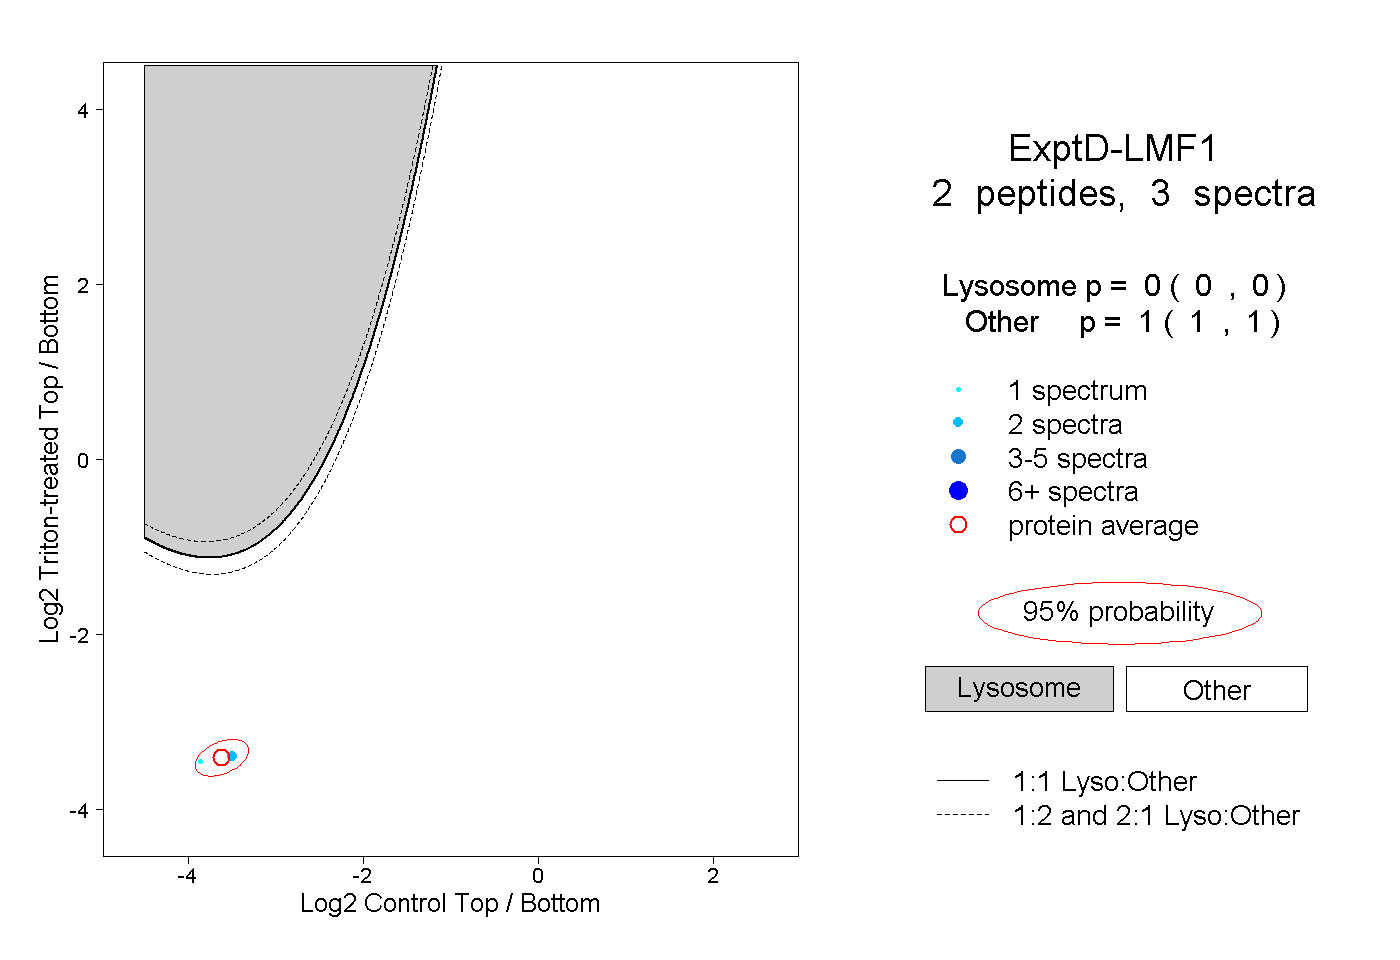 |
0.000 0.000 | 0.000 |
1.000 1.000 | 1.000 |