LMF1
[ENSRNOP00000000246]
Main page
| | | Plot |
Mito |
Lyso |
|
Perox |
ER |
Golgi |
PM |
Cytosol |
Nucleus |
|
| Expt A |
 10
10
peptides |
20
spectra |
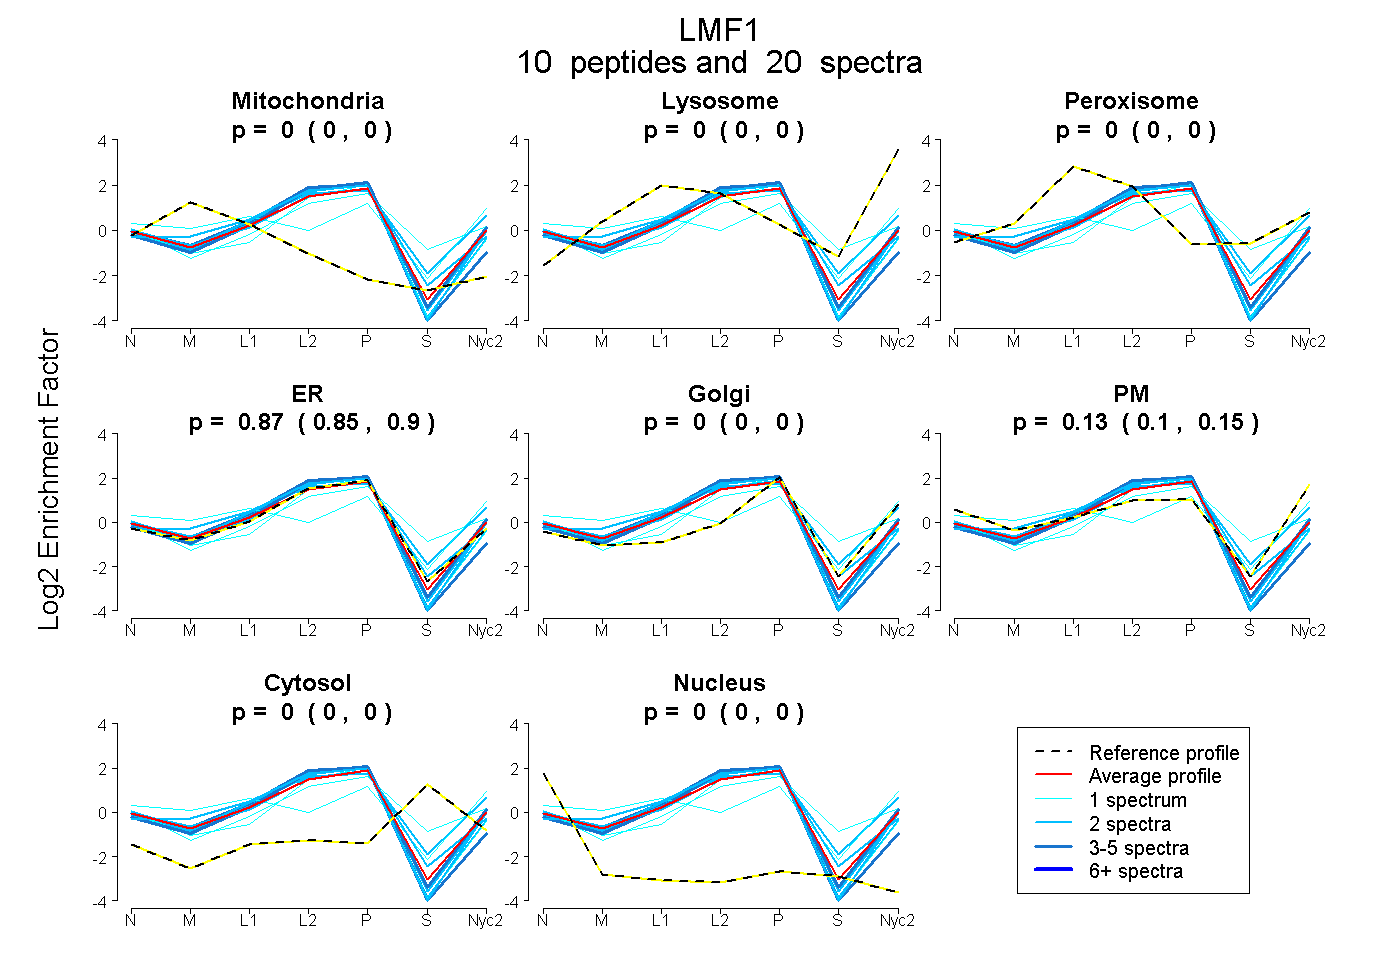 |
0.000
0.000 | 0.001 |
0.000
0.000 | 0.000 |
|
0.000
0.000 | 0.000 |
0.874
0.847 | 0.897 |
0.000
0.000 | 0.000 |
0.126
0.098 | 0.148 |
0.000
0.000 | 0.000 |
0.000
0.000 | 0.000 |
|
| | | Plot |
Mito |
|
Lyso or Perox |
|
ER |
Golgi |
PM |
Cytosol |
Nucleus |
|
| Expt B |
3
peptides |
4
spectra |
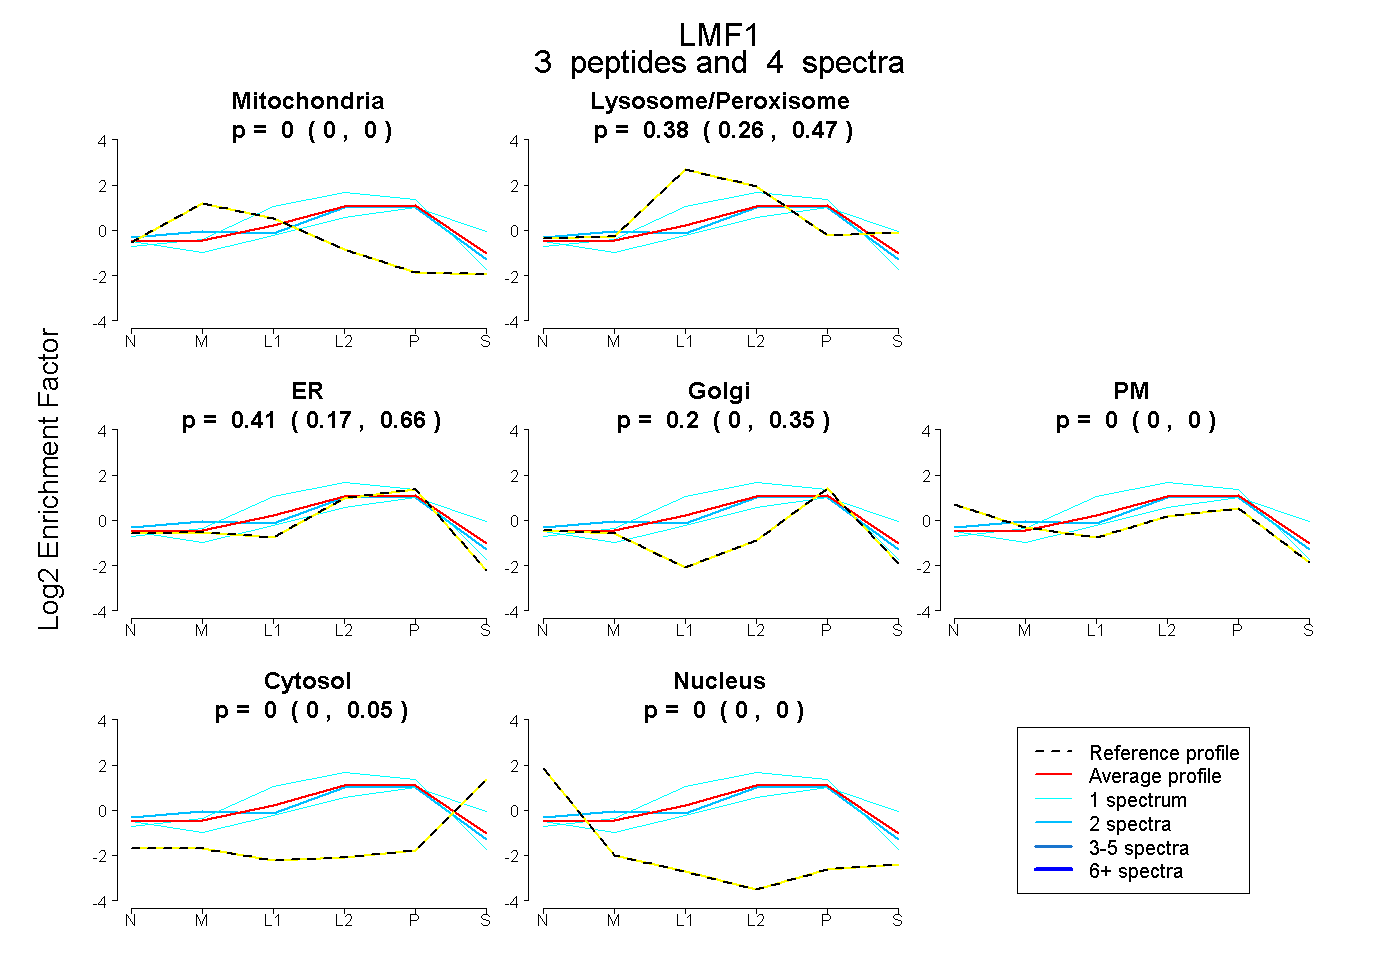 |
0.000
0.000 | 0.000 |
|
0.382
0.257 | 0.471 |
|
0.414
0.173 | 0.658 |
0.203
0.000 | 0.347 |
0.000
0.000 | 0.000 |
0.000
0.000 | 0.054 |
0.000
0.000 | 0.000 |
|
| 1 spectrum, VQPKPR |
0.000 |
|
0.386 |
|
0.142 |
0.320 |
0.000 |
0.151 |
0.000 |
|
| 1 spectrum, VLEMQR |
0.000 |
|
0.400 |
|
0.600 |
0.000 |
0.000 |
0.000 |
0.000 |
|
| 2 spectra, IVNTYGAFGSITK |
0.000 |
|
0.288 |
|
0.449 |
0.166 |
0.097 |
0.000 |
0.000 |
|
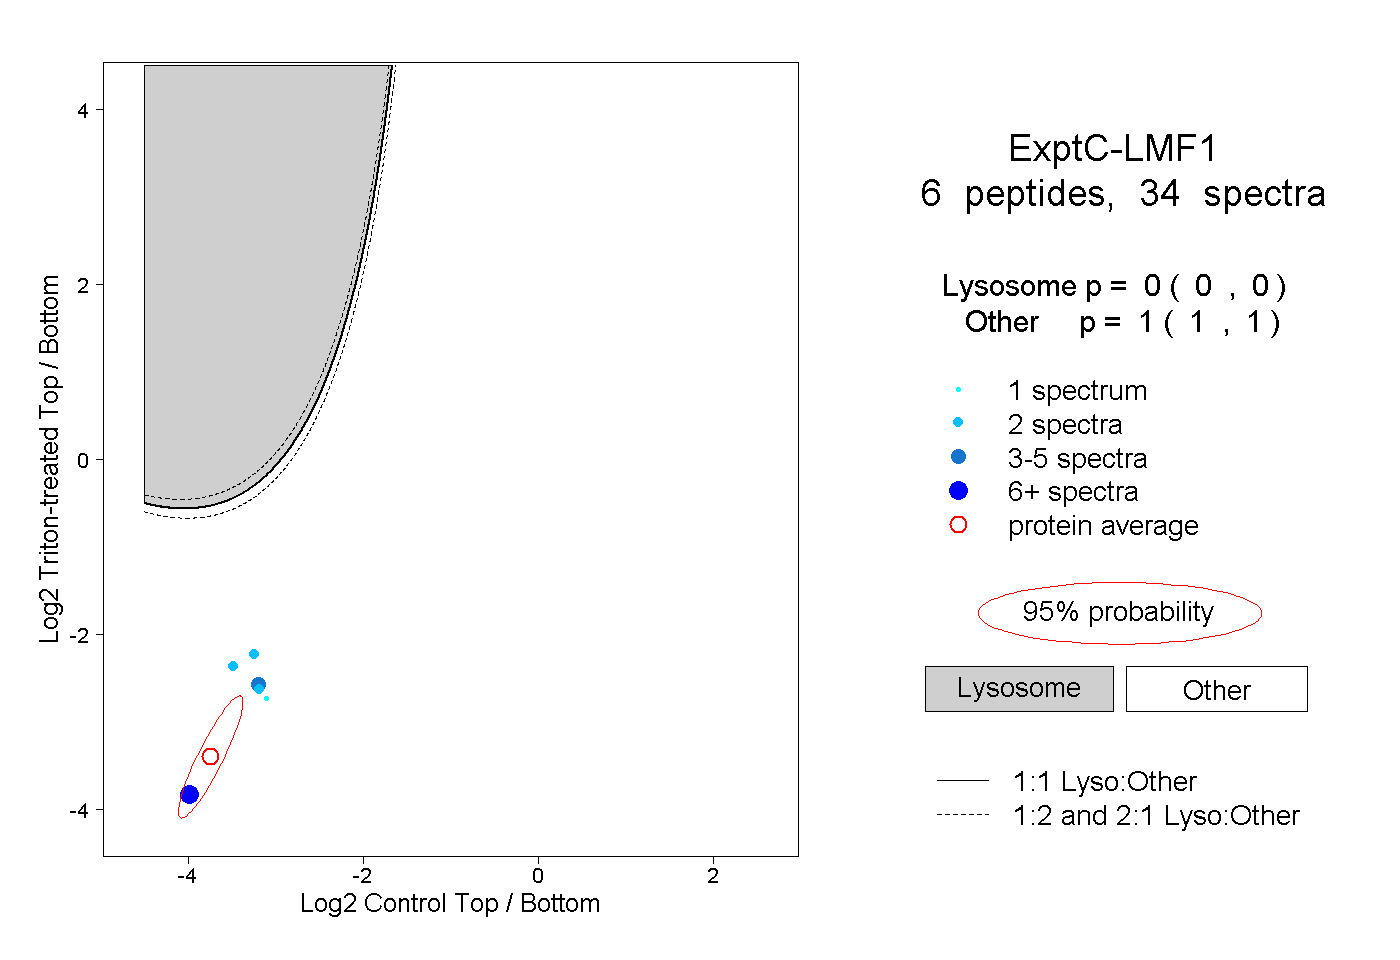
| | | Plot |
|
Lyso |
|
|
|
|
|
|
|
Other |
| Expt C |
6
peptides |
34
spectra |
 |
|
0.000
0.000 | 0.000 |
|
|
|
|
|
|
|
1.000
1.000 | 1.000 |
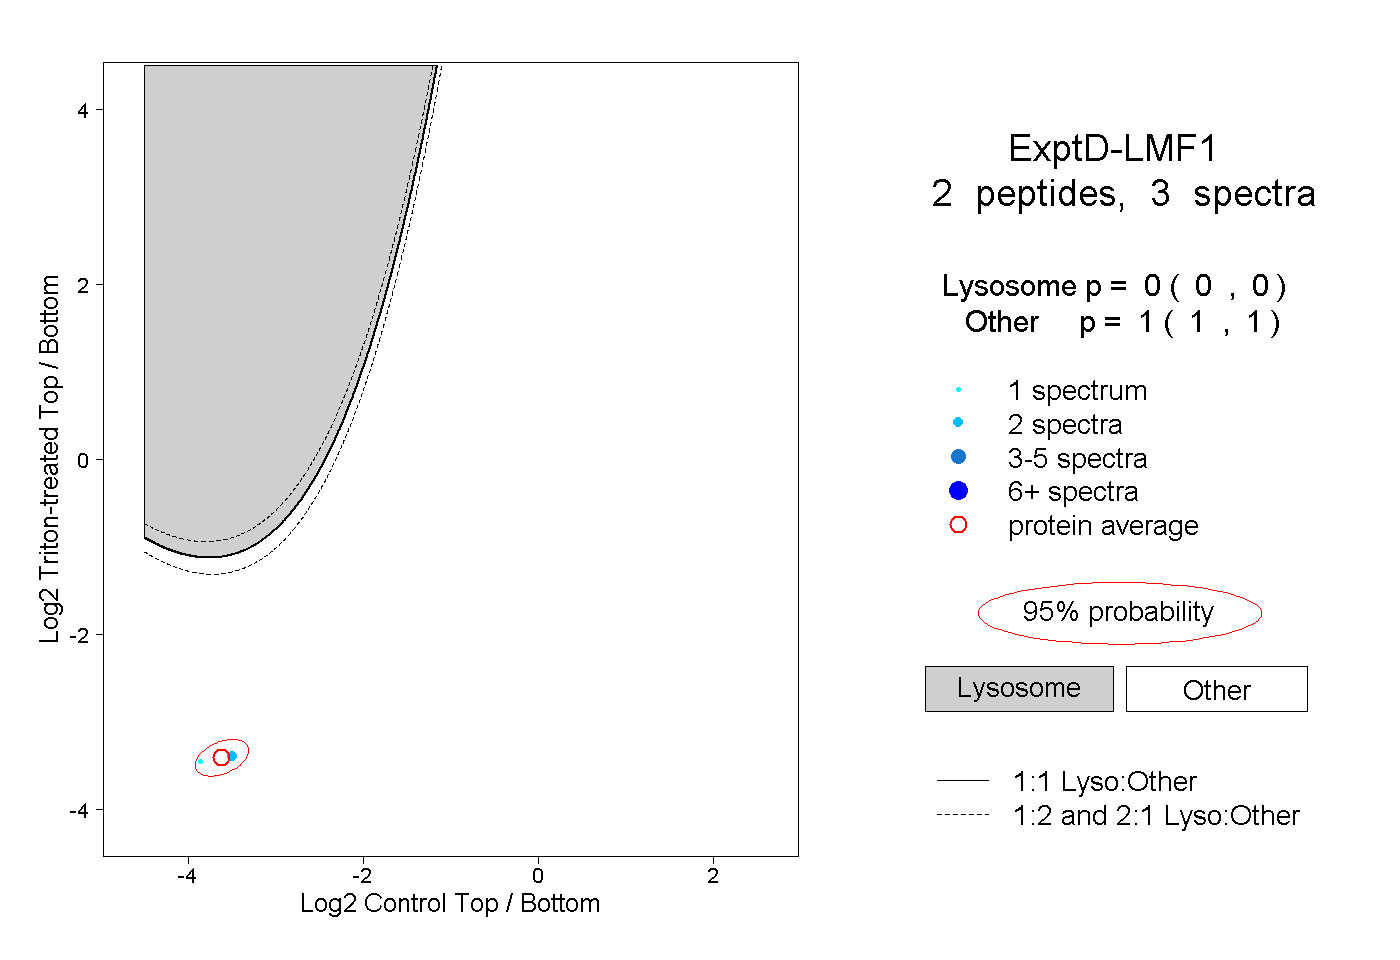
| | | Plot |
|
Lyso |
|
|
|
|
|
|
|
Other |
| Expt D |
2
peptides |
3
spectra |
 |
|
0.000
0.000 | 0.000 |
|
|
|
|
|
|
|
1.000
1.000 | 1.000 |