 10
10peptides
spectra
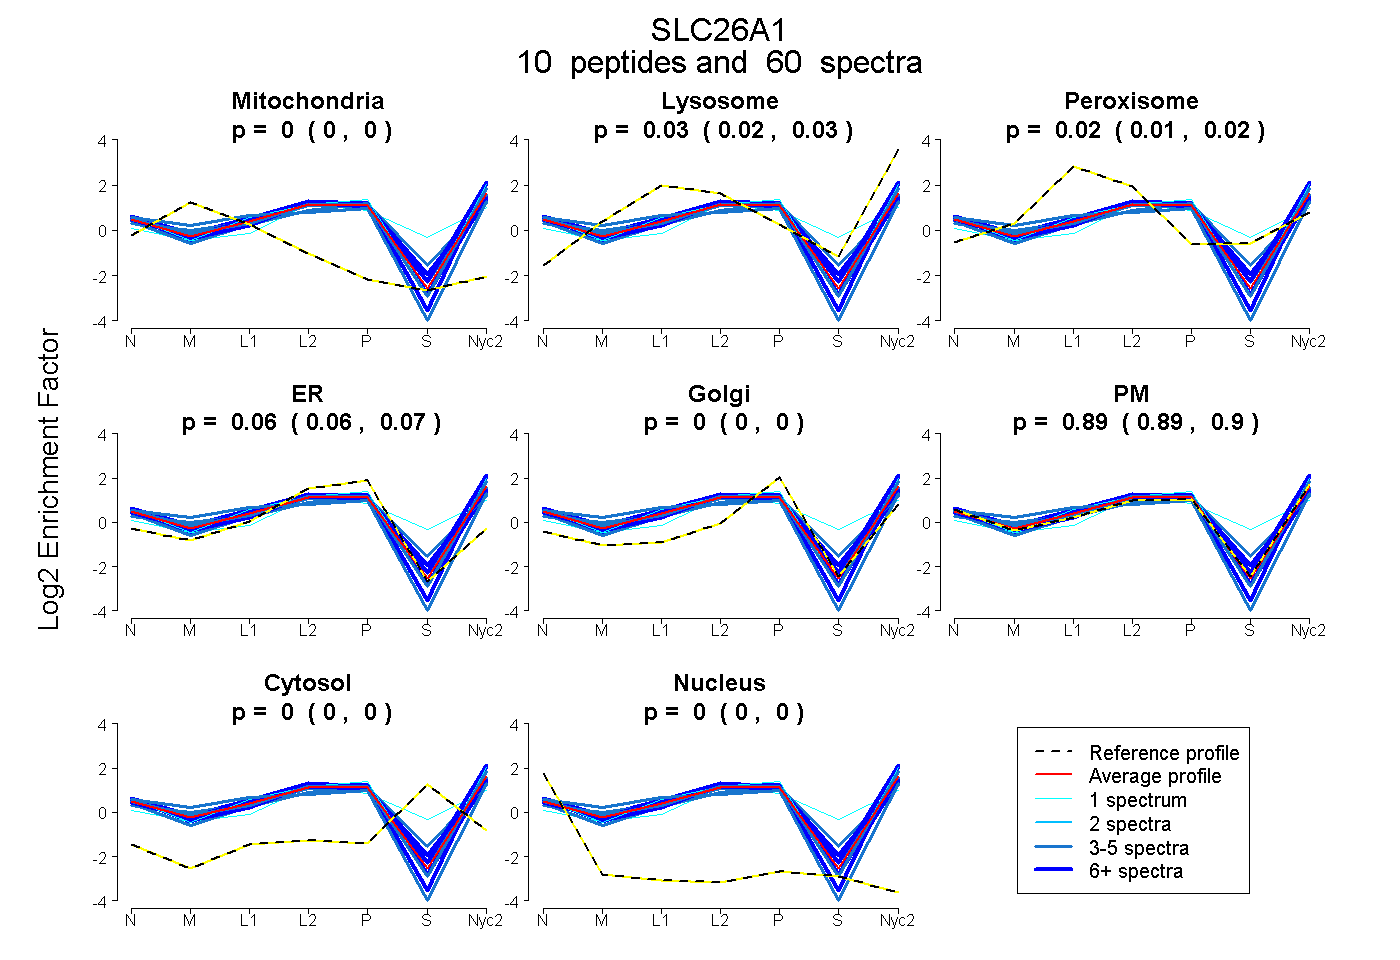
0.000 | 0.000
0.019 | 0.032
0.007 | 0.024
0.056 | 0.070
0.000 | 0.000
0.886 | 0.902
0.000 | 0.000
0.000 | 0.000
6peptides
spectra
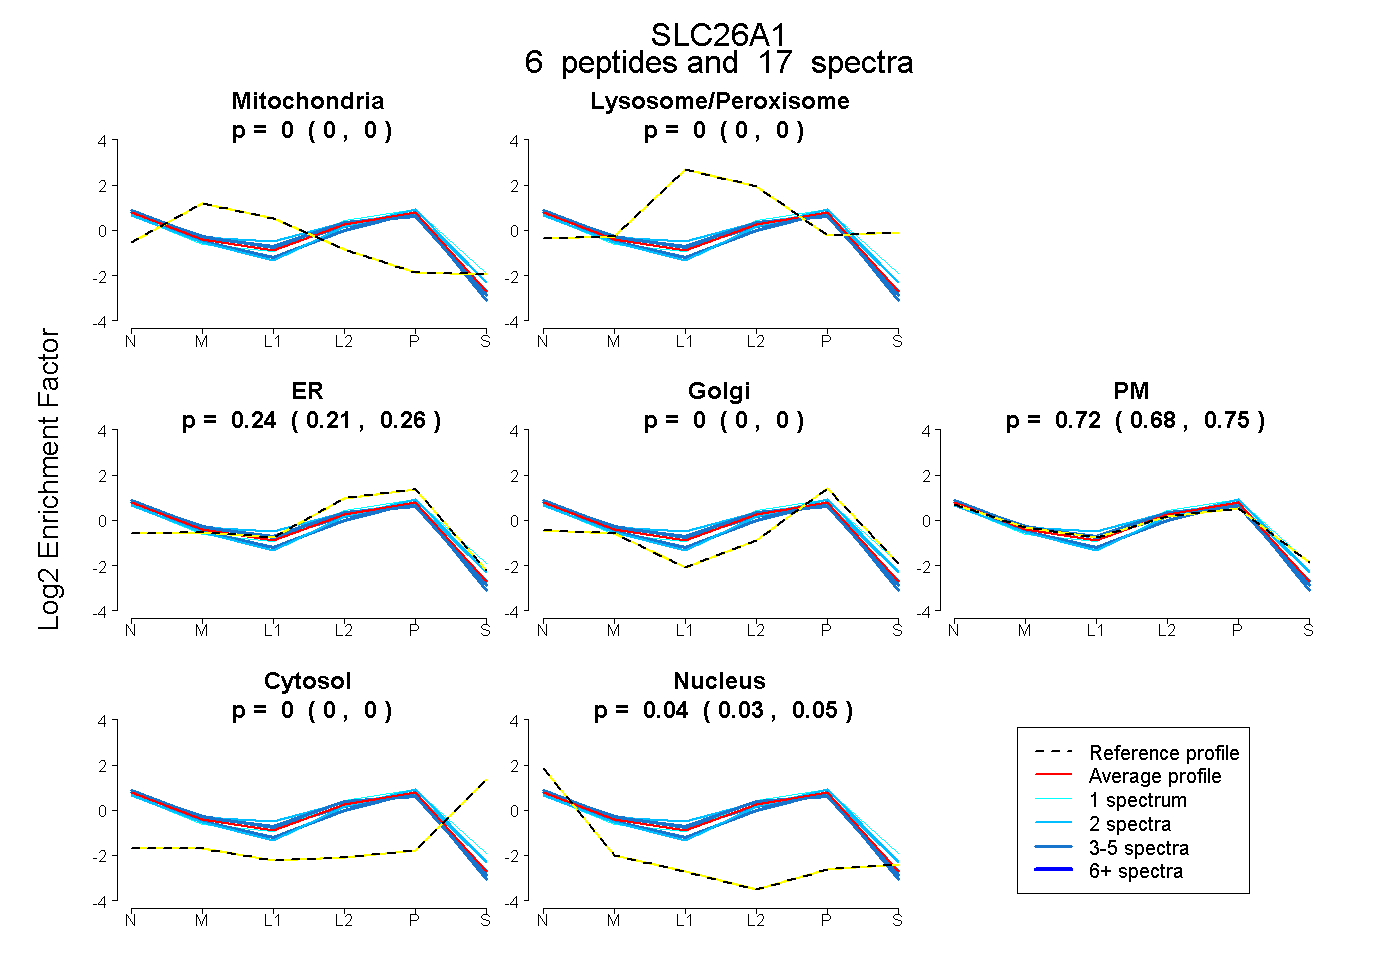
0.000 | 0.000
0.000 | 0.000
0.206 | 0.263
0.000 | 0.000
0.679 | 0.754
0.000 | 0.000
0.033 | 0.052
8peptides
spectra
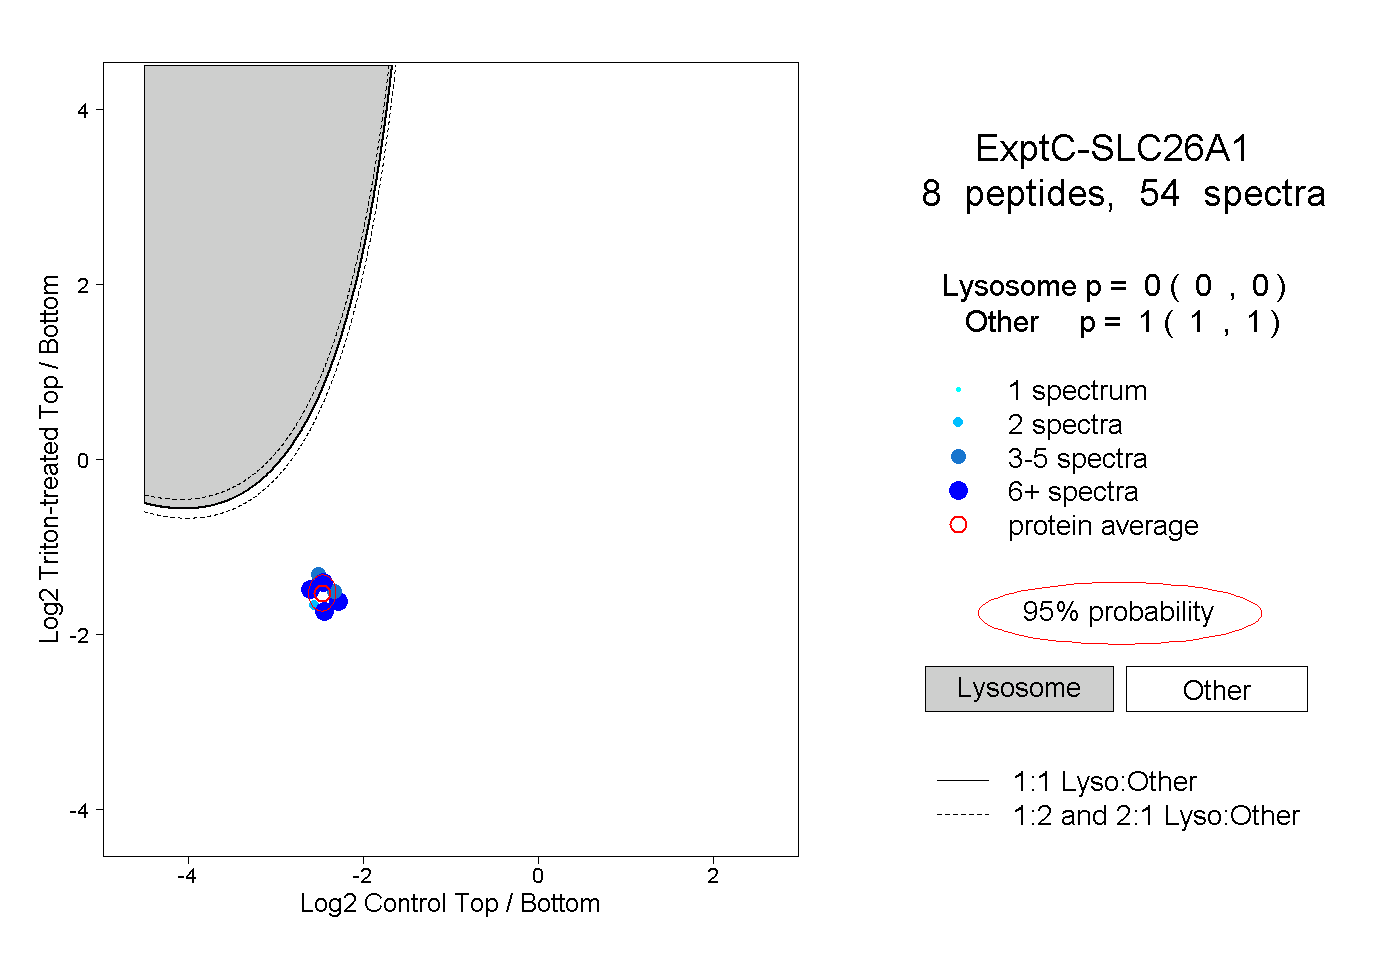
0.000 | 0.000
1.000 | 1.000
5peptides
spectra
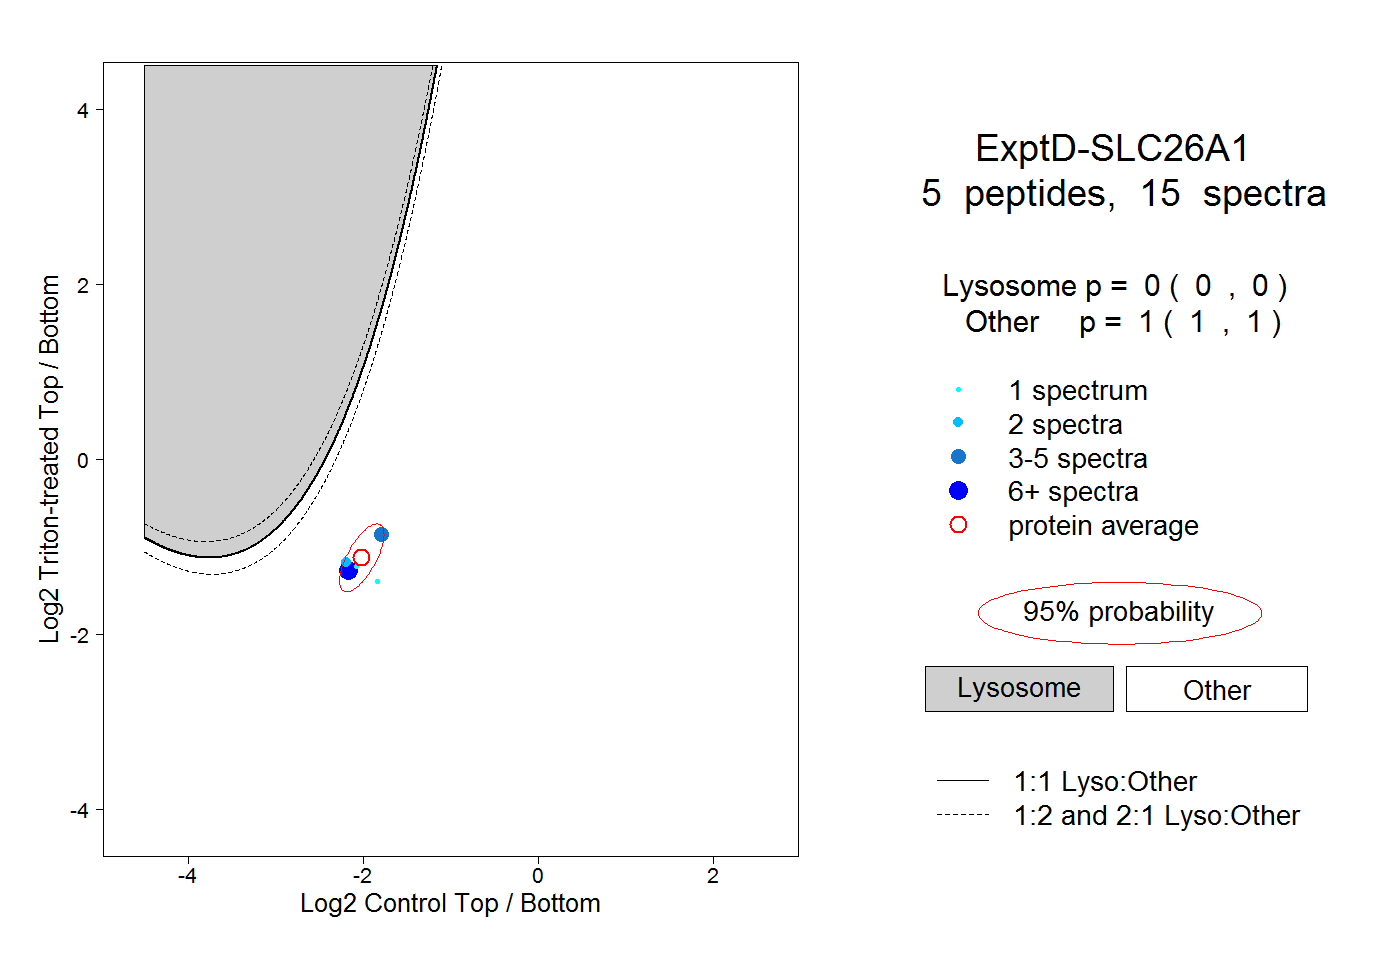
0.000 | 0.000
1.000 | 1.000