 10
10peptides
spectra
0.000 | 0.000
0.019 | 0.032
0.007 | 0.024
0.056 | 0.070
0.000 | 0.000
0.886 | 0.902
0.000 | 0.000
0.000 | 0.000
| Plot | Mito | Lyso | Perox | ER | Golgi | PM | Cytosol | Nucleus | |||||
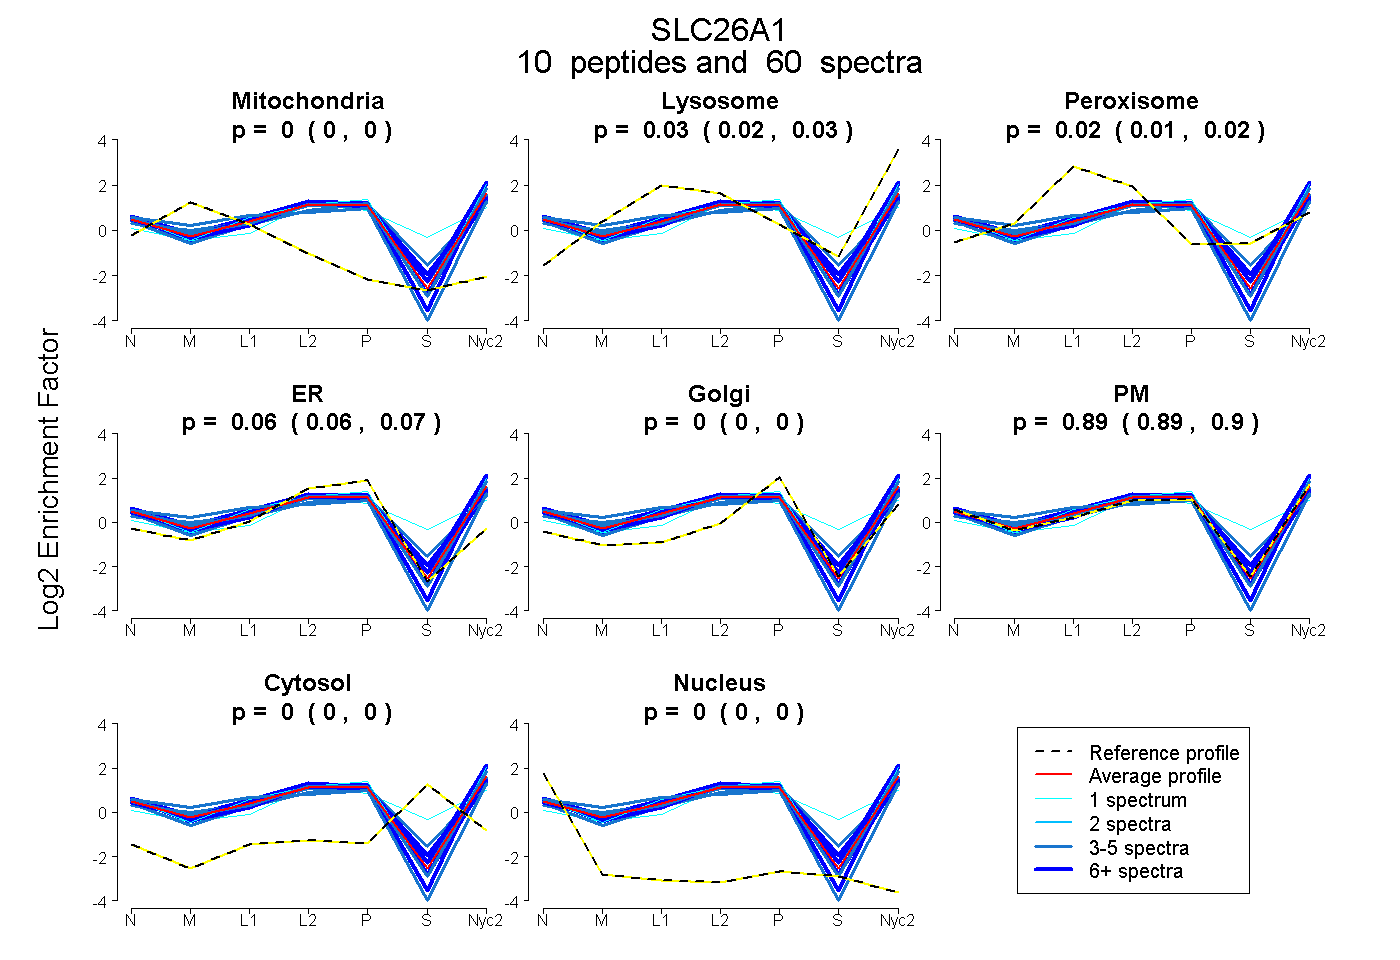
| Expt A |
10 peptides |
60 spectra |
|
0.000 0.000 | 0.000 |
0.026 0.019 | 0.032 |
0.016 0.007 | 0.024 |
0.064 0.056 | 0.070 |
0.000 0.000 | 0.000 |
0.895 0.886 | 0.902 |
0.000 0.000 | 0.000 |
0.000 0.000 | 0.000 |
| 1 spectrum, QPPVSQGLLETLK | 0.000 | 0.036 | 0.000 | 0.000 | 0.000 | 0.964 | 0.000 | 0.000 | ||
| 5 spectra, WLPQYR | 0.000 | 0.019 | 0.000 | 0.000 | 0.000 | 0.981 | 0.000 | 0.000 | ||
| 4 spectra, GGTLVLVR | 0.000 | 0.000 | 0.116 | 0.037 | 0.123 | 0.649 | 0.075 | 0.000 | ||
| 9 spectra, GTEVGVSNR | 0.000 | 0.000 | 0.147 | 0.057 | 0.037 | 0.759 | 0.000 | 0.000 | ||
| 1 spectrum, DCHAIR | 0.000 | 0.083 | 0.121 | 0.106 | 0.000 | 0.454 | 0.236 | 0.000 | ||
| 15 spectra, AALLAR | 0.000 | 0.000 | 0.004 | 0.128 | 0.000 | 0.869 | 0.000 | 0.000 | ||
| 4 spectra, FTGPLYYANK | 0.040 | 0.109 | 0.000 | 0.077 | 0.000 | 0.775 | 0.000 | 0.000 | ||
| 3 spectra, SLYSLTGLDAGYSATR | 0.102 | 0.000 | 0.000 | 0.047 | 0.000 | 0.851 | 0.000 | 0.000 | ||
| 12 spectra, HLLGVR | 0.000 | 0.083 | 0.000 | 0.000 | 0.000 | 0.917 | 0.000 | 0.000 | ||
| 6 spectra, DLPQLWR | 0.000 | 0.002 | 0.000 | 0.000 | 0.000 | 0.998 | 0.000 | 0.000 |
| Plot | Mito | Lyso or Perox | ER | Golgi | PM | Cytosol | Nucleus | ||||||
| Expt B |
6 peptides |
17 spectra |
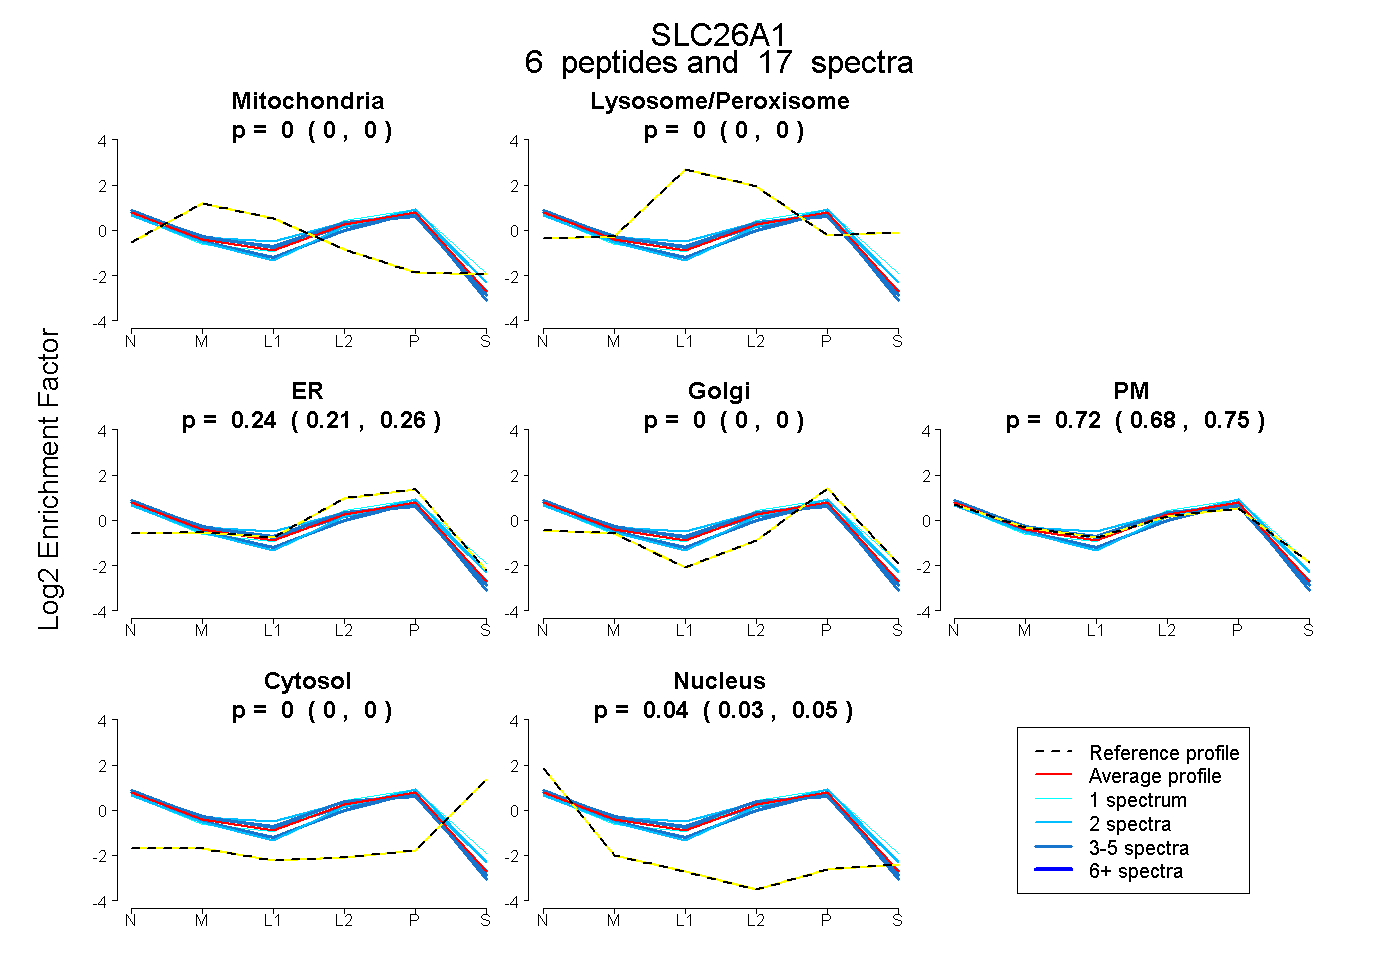 |
0.000 0.000 | 0.000 |
0.000 0.000 | 0.000 |
0.236 0.206 | 0.263 |
0.000 0.000 | 0.000 |
0.721 0.679 | 0.754 |
0.000 0.000 | 0.000 |
0.043 0.033 | 0.052 |
|||
| Plot | Lyso | Other | |||||||||||
| Expt C |
8 peptides |
54 spectra |
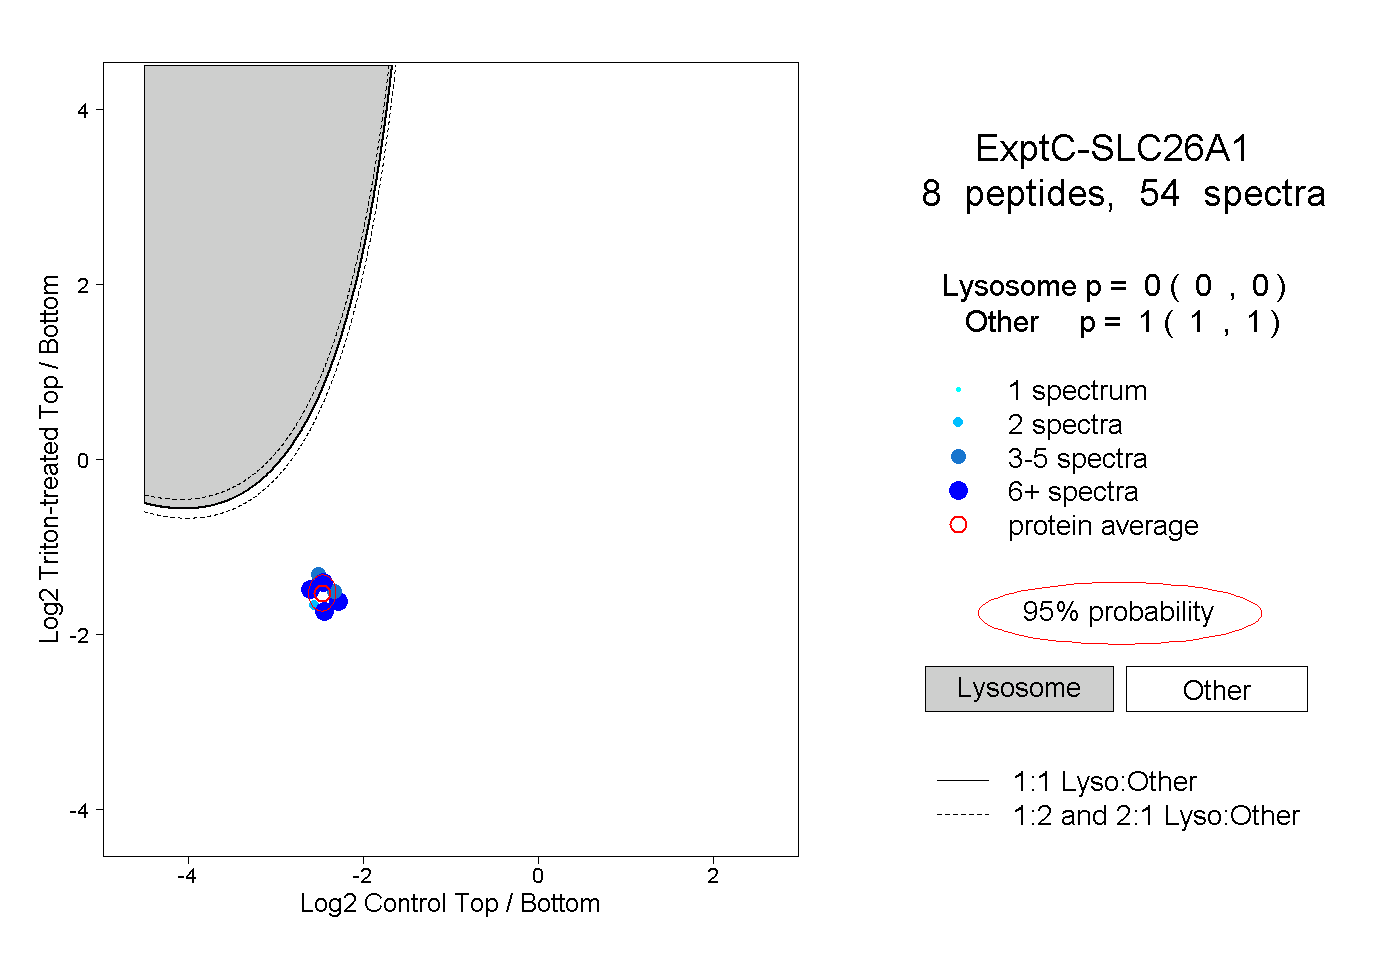 |
0.000 0.000 | 0.000 |
1.000 1.000 | 1.000 |
||||||||
| Plot | Lyso | Other | |||||||||||
| Expt D |
5 peptides |
15 spectra |
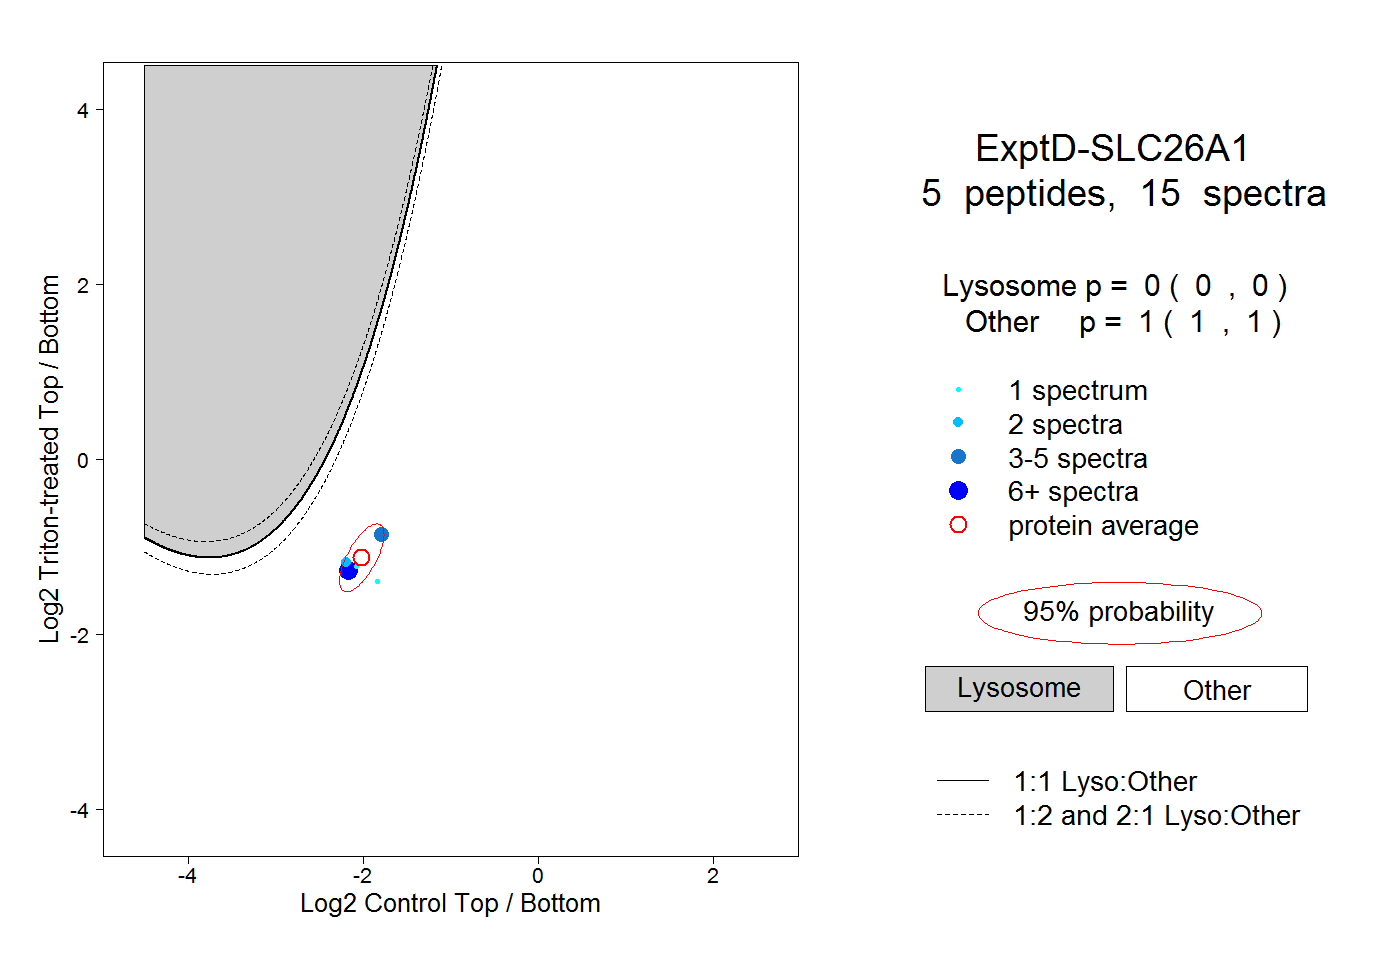 |
0.000 0.000 | 0.000 |
1.000 1.000 | 1.000 |