SLC26A1
[ENSRNOP00000000047]
Main page
| | | Plot |
Mito |
Lyso |
|
Perox |
ER |
Golgi |
PM |
Cytosol |
Nucleus |
|
| Expt A |
 10
10
peptides |
60
spectra |
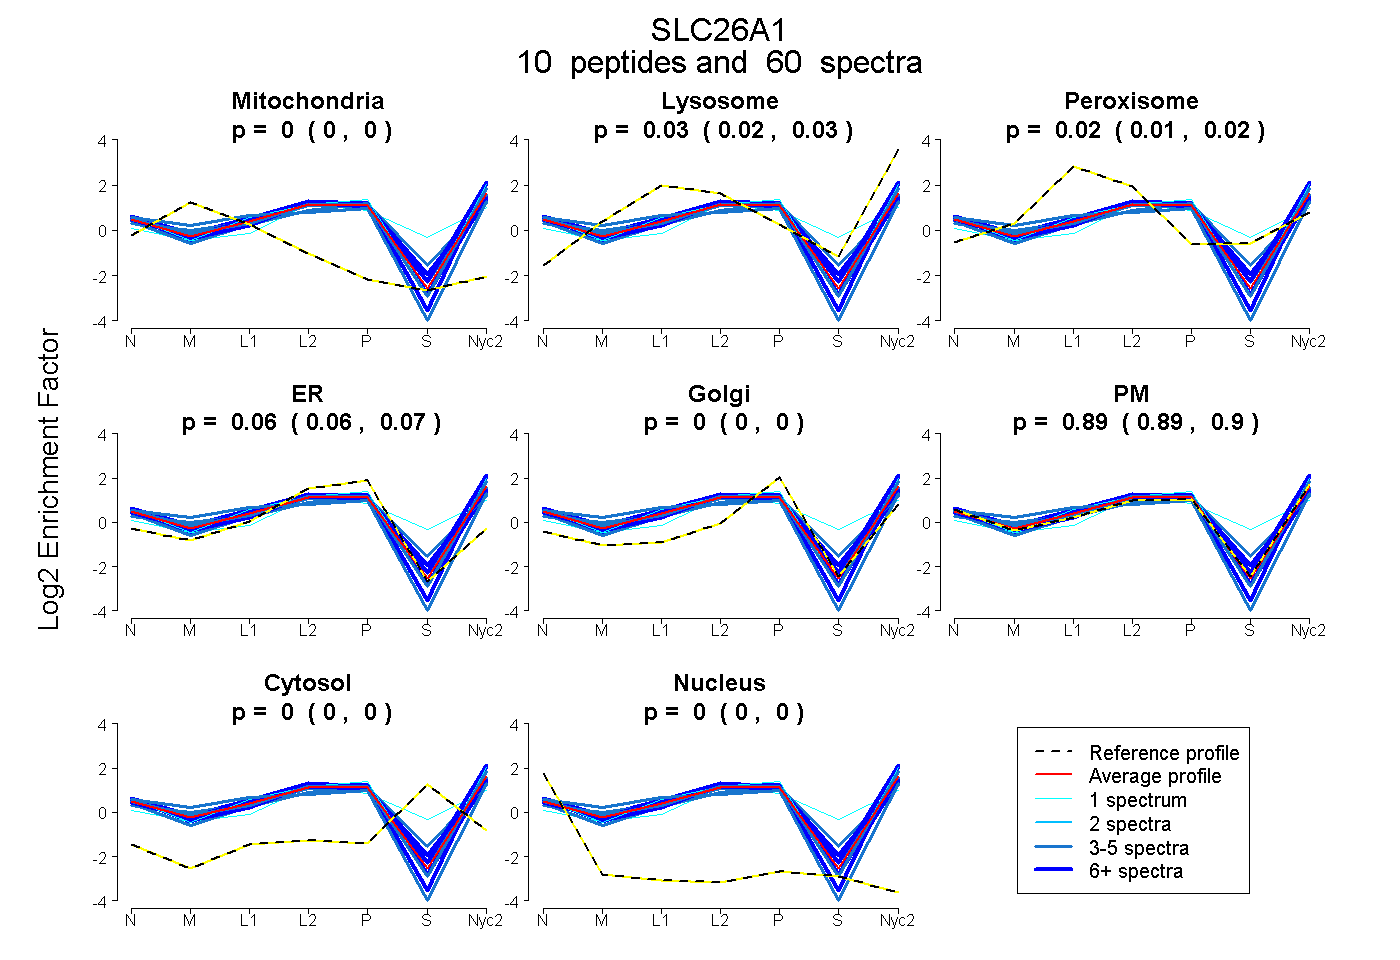 |
0.000
0.000 | 0.000 |
0.026
0.019 | 0.032 |
|
0.016
0.007 | 0.024 |
0.064
0.056 | 0.070 |
0.000
0.000 | 0.000 |
0.895
0.886 | 0.902 |
0.000
0.000 | 0.000 |
0.000
0.000 | 0.000 |
|
| | | Plot |
Mito |
|
Lyso or Perox |
|
ER |
Golgi |
PM |
Cytosol |
Nucleus |
|
| Expt B |
6
peptides |
17
spectra |
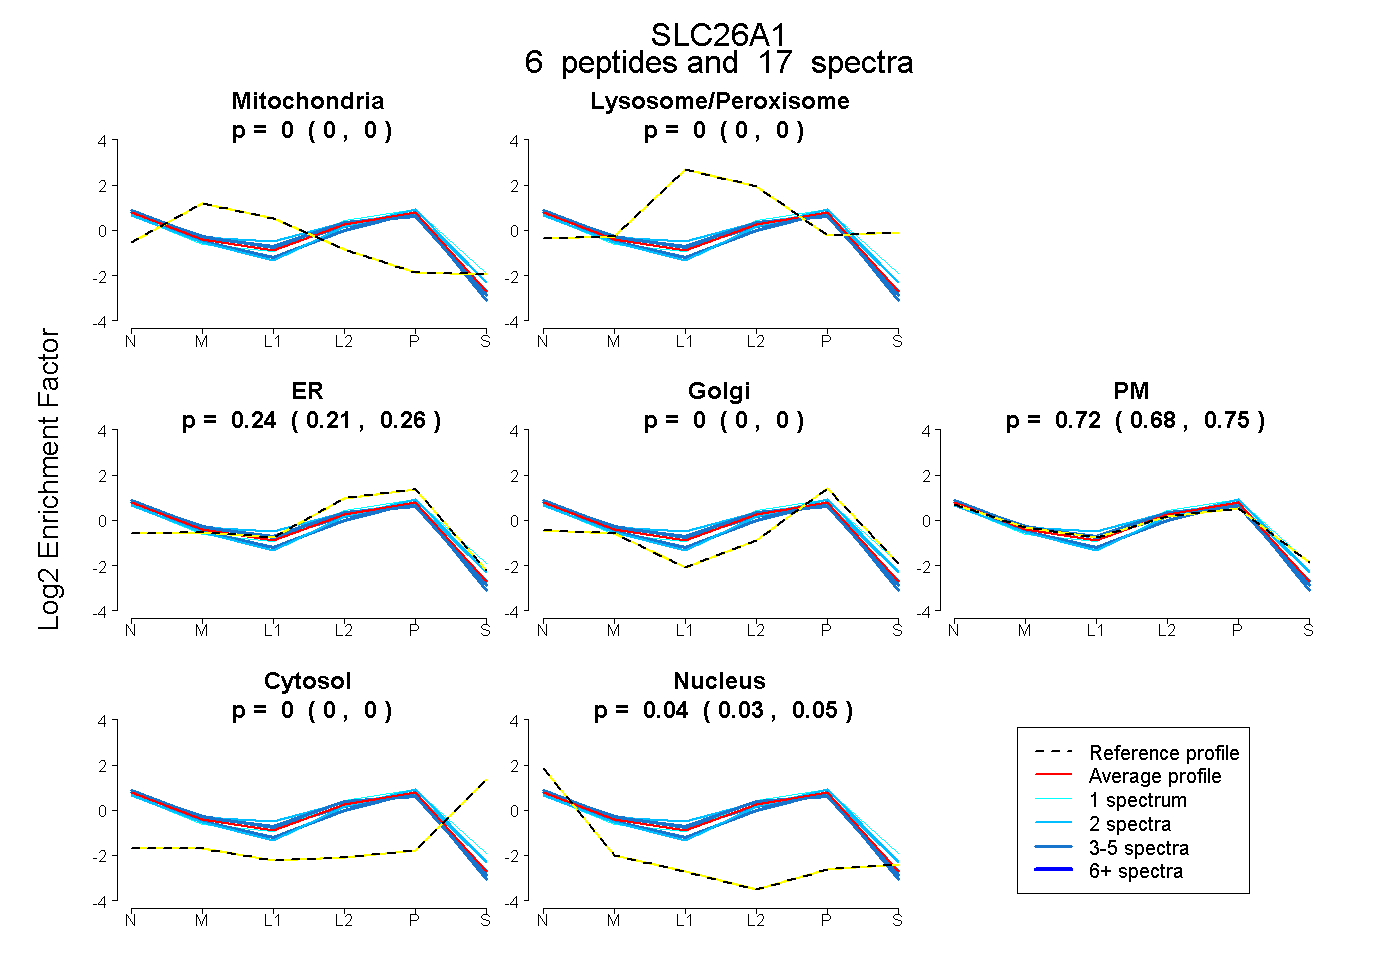 |
0.000
0.000 | 0.000 |
|
0.000
0.000 | 0.000 |
|
0.236
0.206 | 0.263 |
0.000
0.000 | 0.000 |
0.721
0.679 | 0.754 |
0.000
0.000 | 0.000 |
0.043
0.033 | 0.052 |
|
| 1 spectrum, FTGPLYYANK |
0.000 |
|
0.000 |
|
0.210 |
0.016 |
0.774 |
0.000 |
0.000 |
|
| 4 spectra, AALLAR |
0.000 |
|
0.000 |
|
0.144 |
0.000 |
0.829 |
0.000 |
0.027 |
|
| 3 spectra, GGTLVLVR |
0.000 |
|
0.000 |
|
0.354 |
0.000 |
0.518 |
0.000 |
0.128 |
|
| 5 spectra, HLLGVR |
0.000 |
|
0.000 |
|
0.147 |
0.000 |
0.839 |
0.000 |
0.014 |
|
| 2 spectra, GTEVGVSNR |
0.000 |
|
0.000 |
|
0.140 |
0.187 |
0.650 |
0.000 |
0.022 |
|
| 2 spectra, DLPQLWR |
0.000 |
|
0.009 |
|
0.145 |
0.000 |
0.847 |
0.000 |
0.000 |
|
| | | Plot |
|
Lyso |
|
|
|
|
|
|
|
Other |
| Expt C |
8
peptides |
54
spectra |
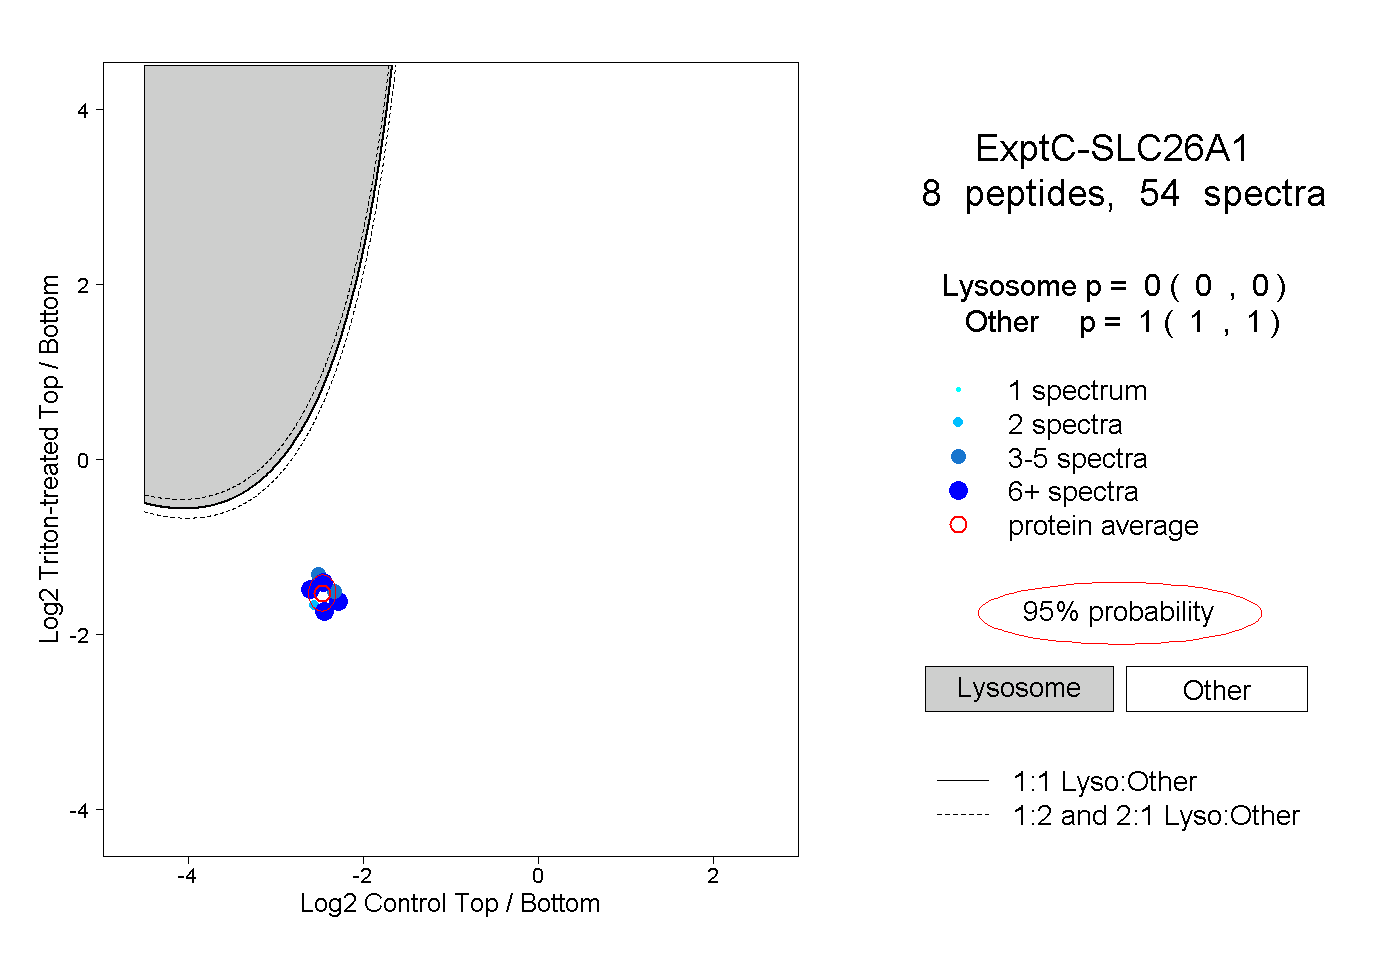 |
|
0.000
0.000 | 0.000 |
|
|
|
|
|
|
|
1.000
1.000 | 1.000 |
| | | Plot |
|
Lyso |
|
|
|
|
|
|
|
Other |
| Expt D |
5
peptides |
15
spectra |
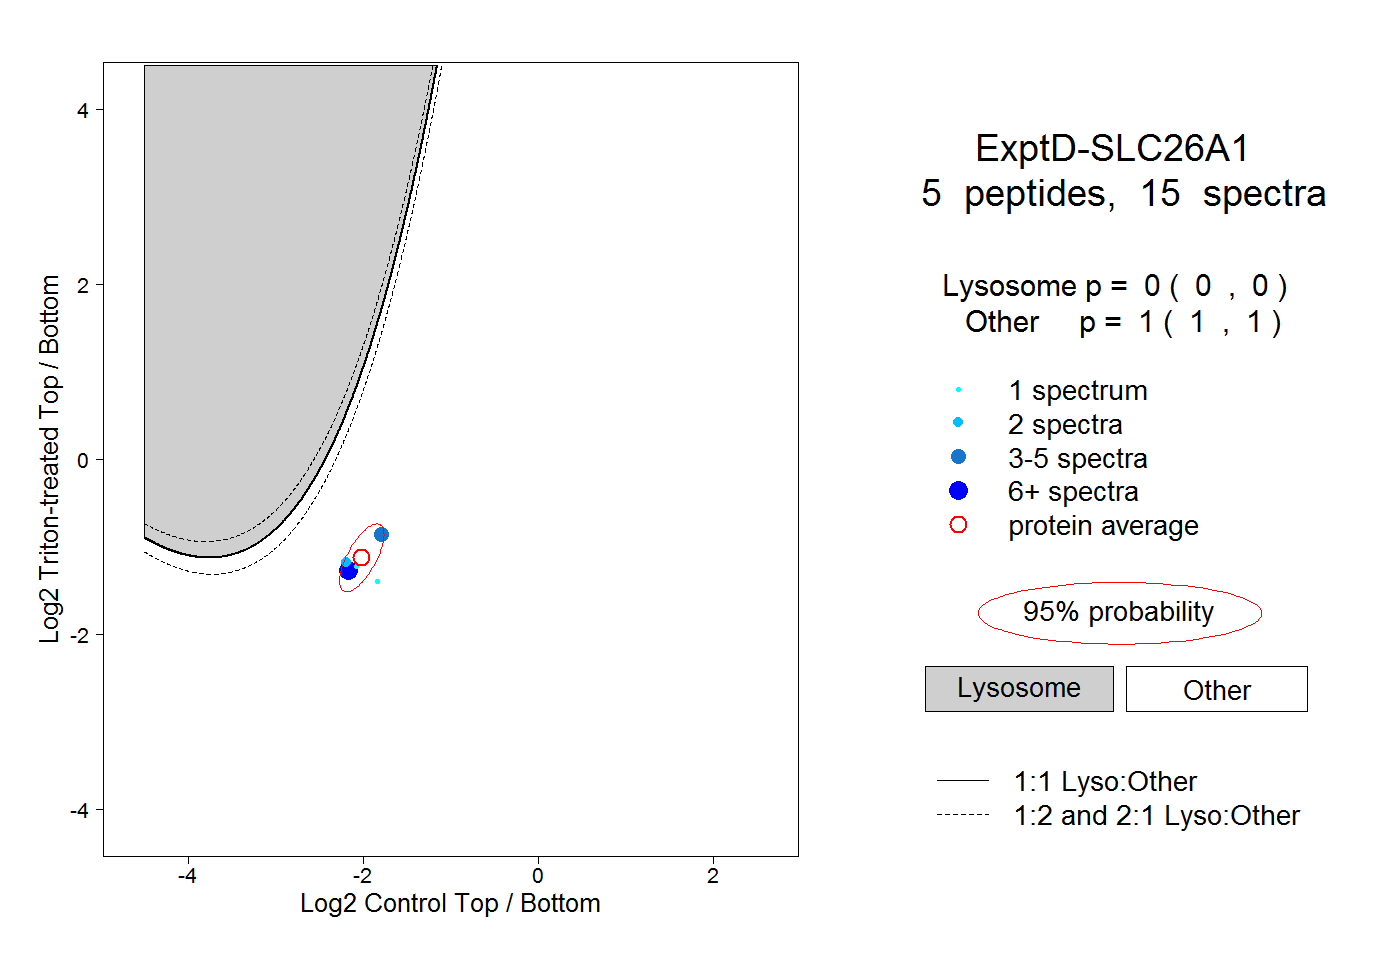 |
|
0.000
0.000 | 0.000 |
|
|
|
|
|
|
|
1.000
1.000 | 1.000 |