 12
12peptides
spectra
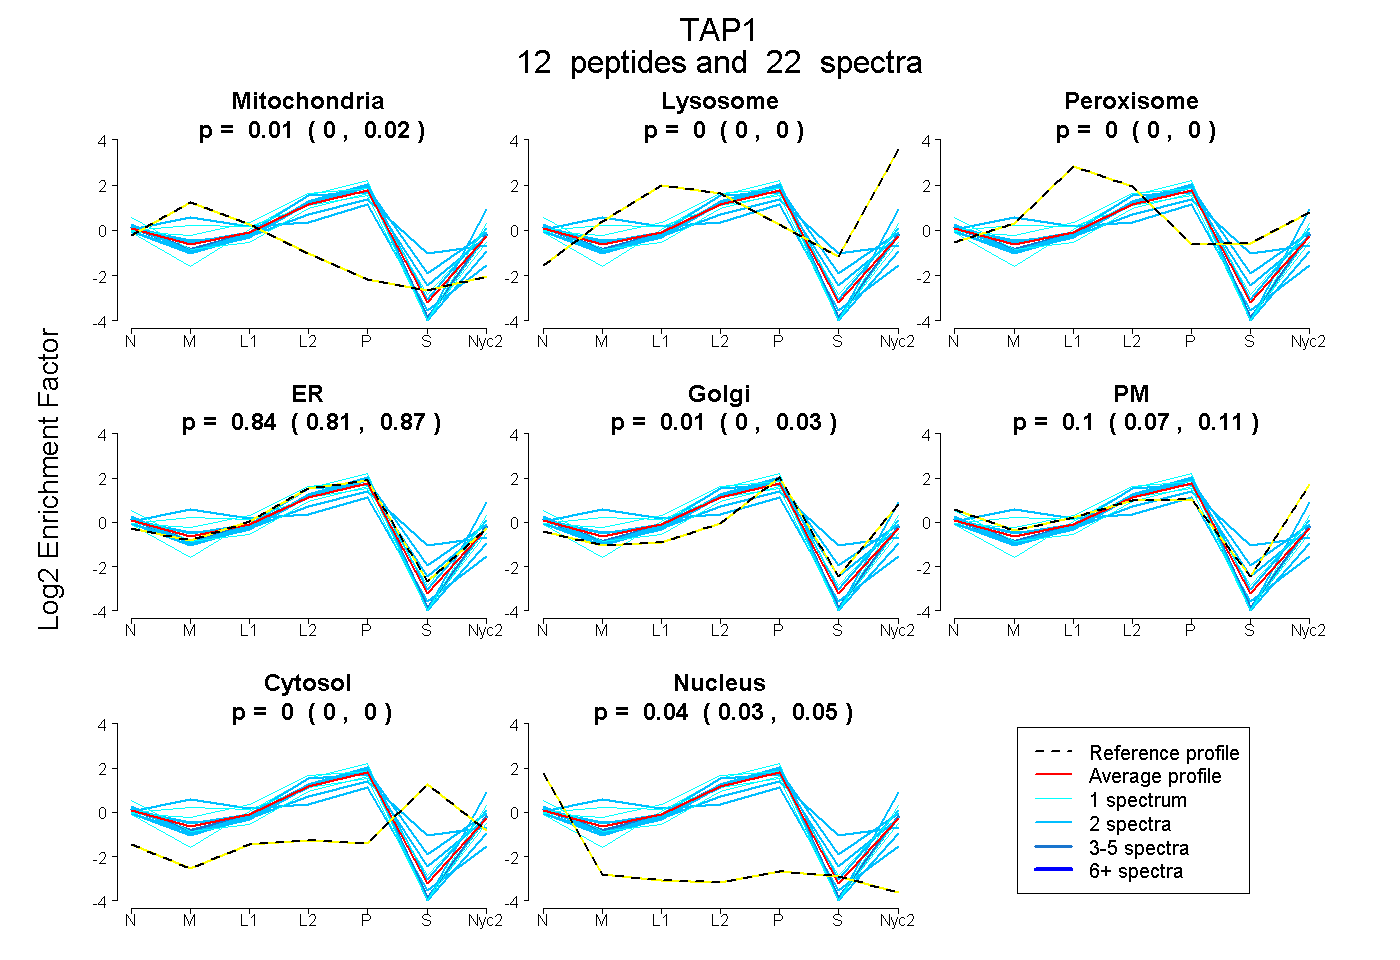
0.000 | 0.022
0.000 | 0.000
0.000 | 0.000
0.812 | 0.865
0.000 | 0.030
0.069 | 0.115
0.000 | 0.000
0.034 | 0.050
5peptides
spectra
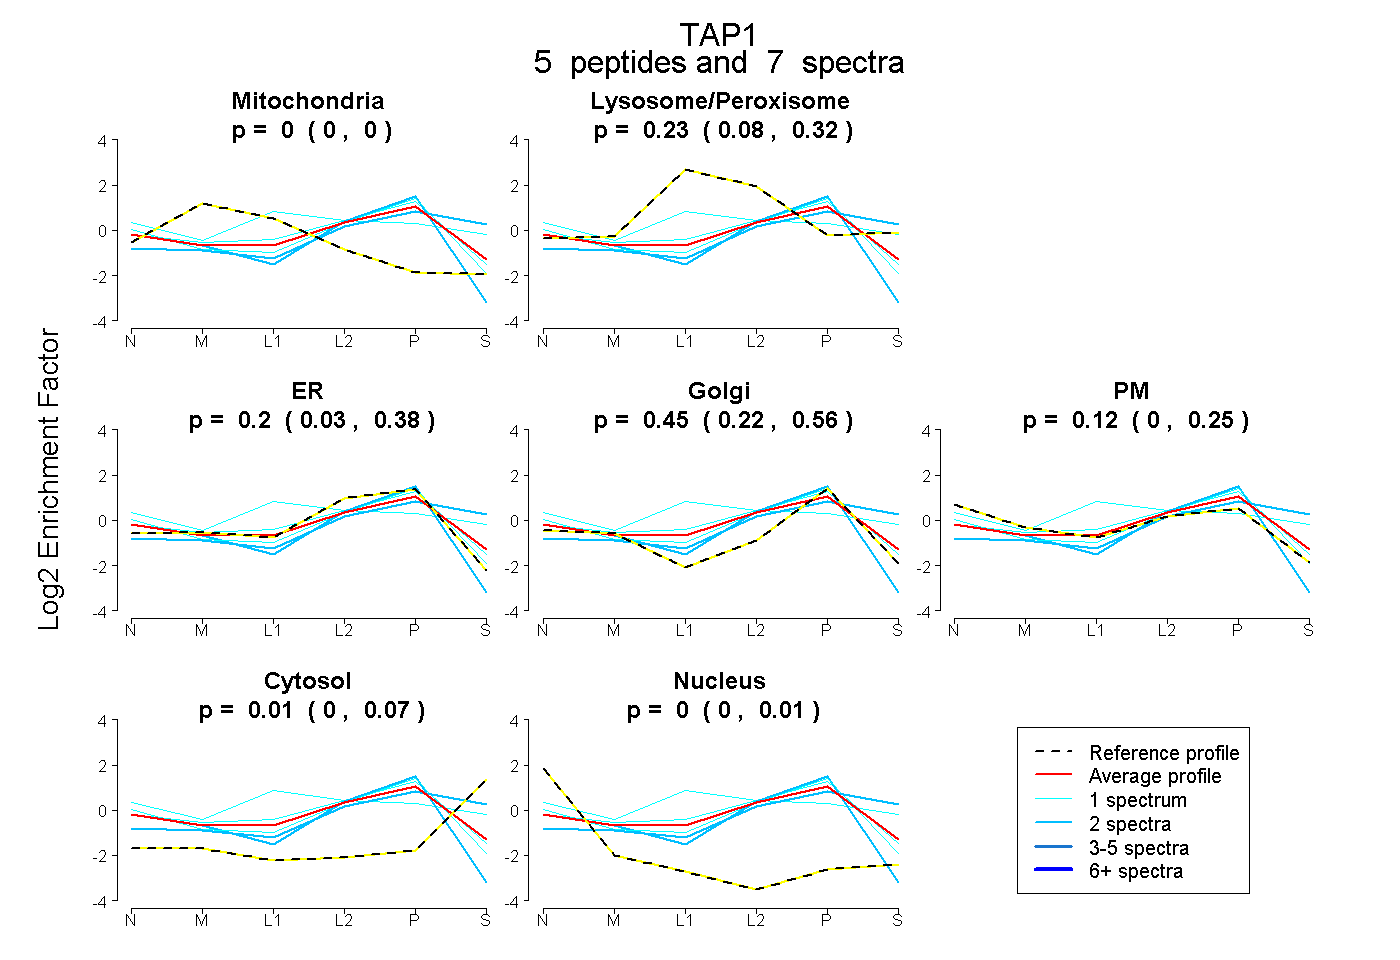
0.000 | 0.000
0.082 | 0.322
0.031 | 0.384
0.218 | 0.565
0.000 | 0.253
0.000 | 0.072
0.000 | 0.006
17peptides
spectra
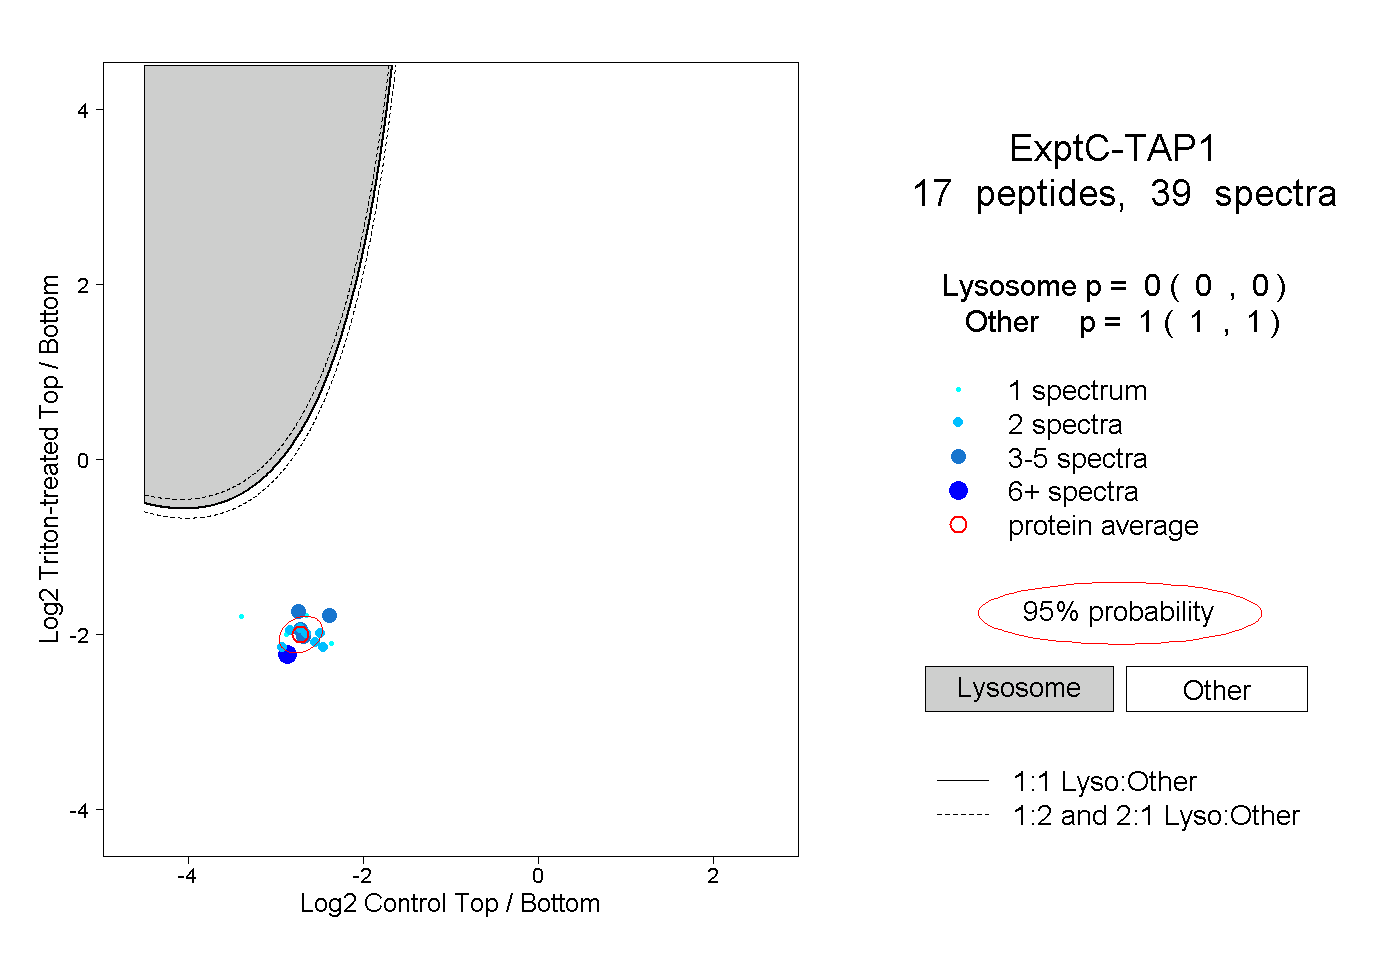
0.000 | 0.000
1.000 | 1.000
6peptides
spectra
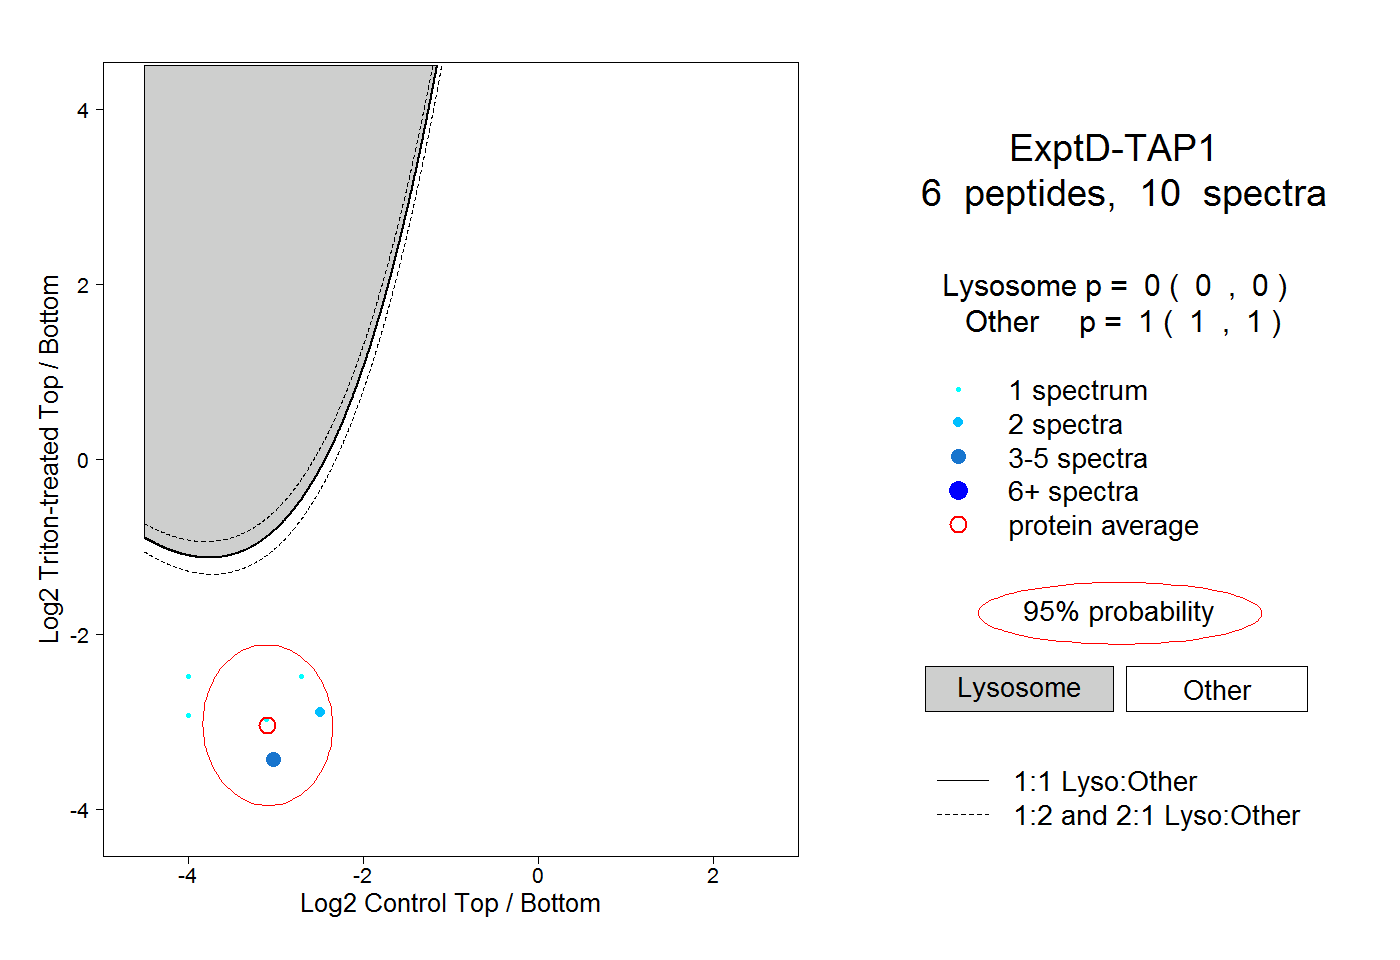
0.000 | 0.000
1.000 | 1.000