 12
12peptides
spectra
0.000 | 0.022
0.000 | 0.000
0.000 | 0.000
0.812 | 0.865
0.000 | 0.030
0.069 | 0.115
0.000 | 0.000
0.034 | 0.050
| Plot | Mito | Lyso | Perox | ER | Golgi | PM | Cytosol | Nucleus | |||||
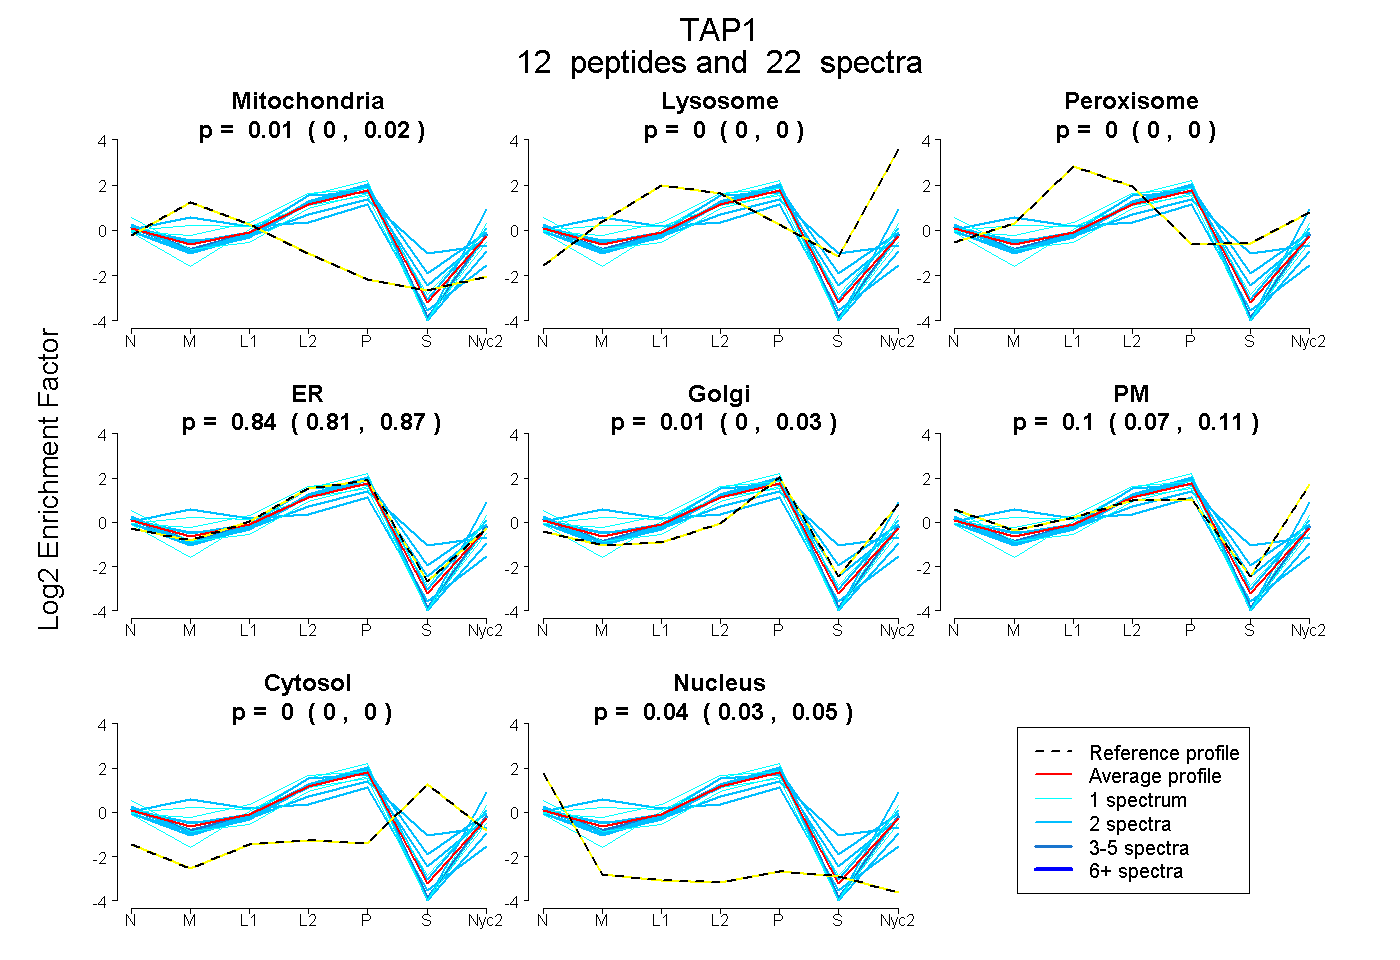
| Expt A |
12 peptides |
22 spectra |
|
0.009 0.000 | 0.022 |
0.000 0.000 | 0.000 |
0.000 0.000 | 0.000 |
0.842 0.812 | 0.865 |
0.010 0.000 | 0.030 |
0.096 0.069 | 0.115 |
0.000 0.000 | 0.000 |
0.044 0.034 | 0.050 |
| 2 spectra, QAVALAR | 0.000 | 0.000 | 0.000 | 0.732 | 0.127 | 0.061 | 0.080 | 0.000 | ||
| 1 spectrum, VHGEVFR | 0.000 | 0.000 | 0.000 | 0.775 | 0.000 | 0.225 | 0.000 | 0.000 | ||
| 2 spectra, MLGFLDSK | 0.028 | 0.000 | 0.001 | 0.850 | 0.000 | 0.110 | 0.000 | 0.010 | ||
| 1 spectrum, STQVALEALSAMPTVR | 0.144 | 0.000 | 0.000 | 0.731 | 0.000 | 0.125 | 0.000 | 0.000 | ||
| 4 spectra, GVLGVTAGAR | 0.000 | 0.000 | 0.000 | 0.883 | 0.046 | 0.038 | 0.000 | 0.033 | ||
| 2 spectra, NPTGSITSR | 0.000 | 0.000 | 0.000 | 0.458 | 0.198 | 0.344 | 0.000 | 0.000 | ||
| 1 spectrum, AHHILFLK | 0.000 | 0.000 | 0.000 | 0.973 | 0.000 | 0.000 | 0.000 | 0.027 | ||
| 1 spectrum, VWAVGLSR | 0.000 | 0.000 | 0.000 | 0.569 | 0.100 | 0.246 | 0.000 | 0.085 | ||
| 2 spectra, EGSVCEQGTHLQLMER | 0.044 | 0.000 | 0.043 | 0.671 | 0.011 | 0.013 | 0.218 | 0.000 | ||
| 2 spectra, ENIAYGLTR | 0.371 | 0.000 | 0.000 | 0.629 | 0.000 | 0.000 | 0.000 | 0.000 | ||
| 2 spectra, LLYESPEWASR | 0.000 | 0.000 | 0.000 | 0.920 | 0.000 | 0.000 | 0.000 | 0.080 | ||
| 2 spectra, LSAWGALR | 0.000 | 0.000 | 0.000 | 0.766 | 0.200 | 0.031 | 0.000 | 0.004 |
| Plot | Mito | Lyso or Perox | ER | Golgi | PM | Cytosol | Nucleus | ||||||
| Expt B |
5 peptides |
7 spectra |
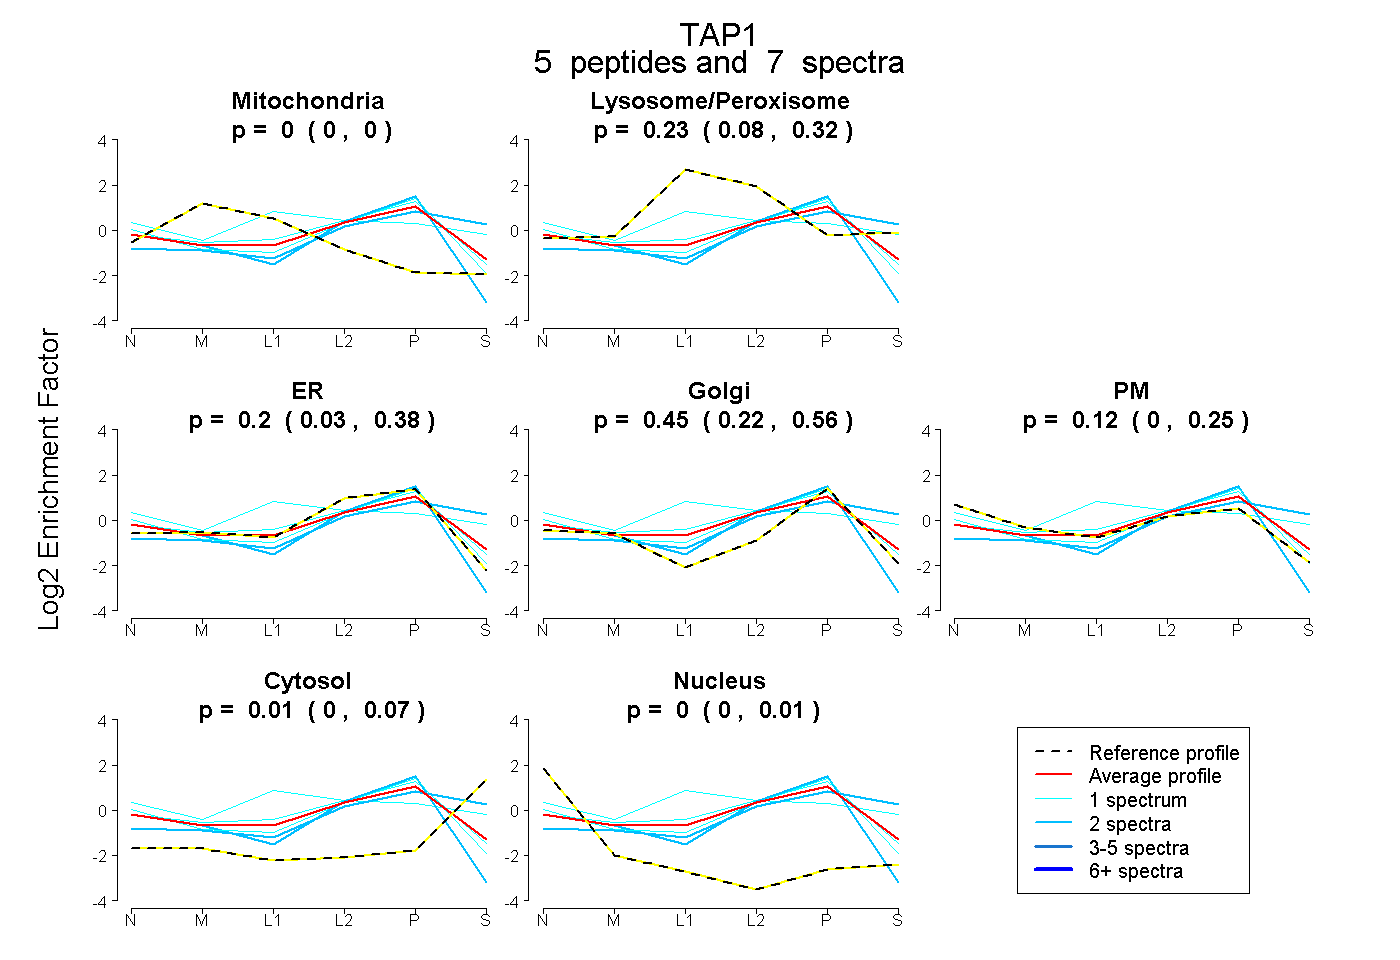 |
0.000 0.000 | 0.000 |
0.226 0.082 | 0.322 |
0.196 0.031 | 0.384 |
0.445 0.218 | 0.565 |
0.120 0.000 | 0.253 |
0.013 0.000 | 0.072 |
0.000 0.000 | 0.006 |
|||
| Plot | Lyso | Other | |||||||||||
| Expt C |
17 peptides |
39 spectra |
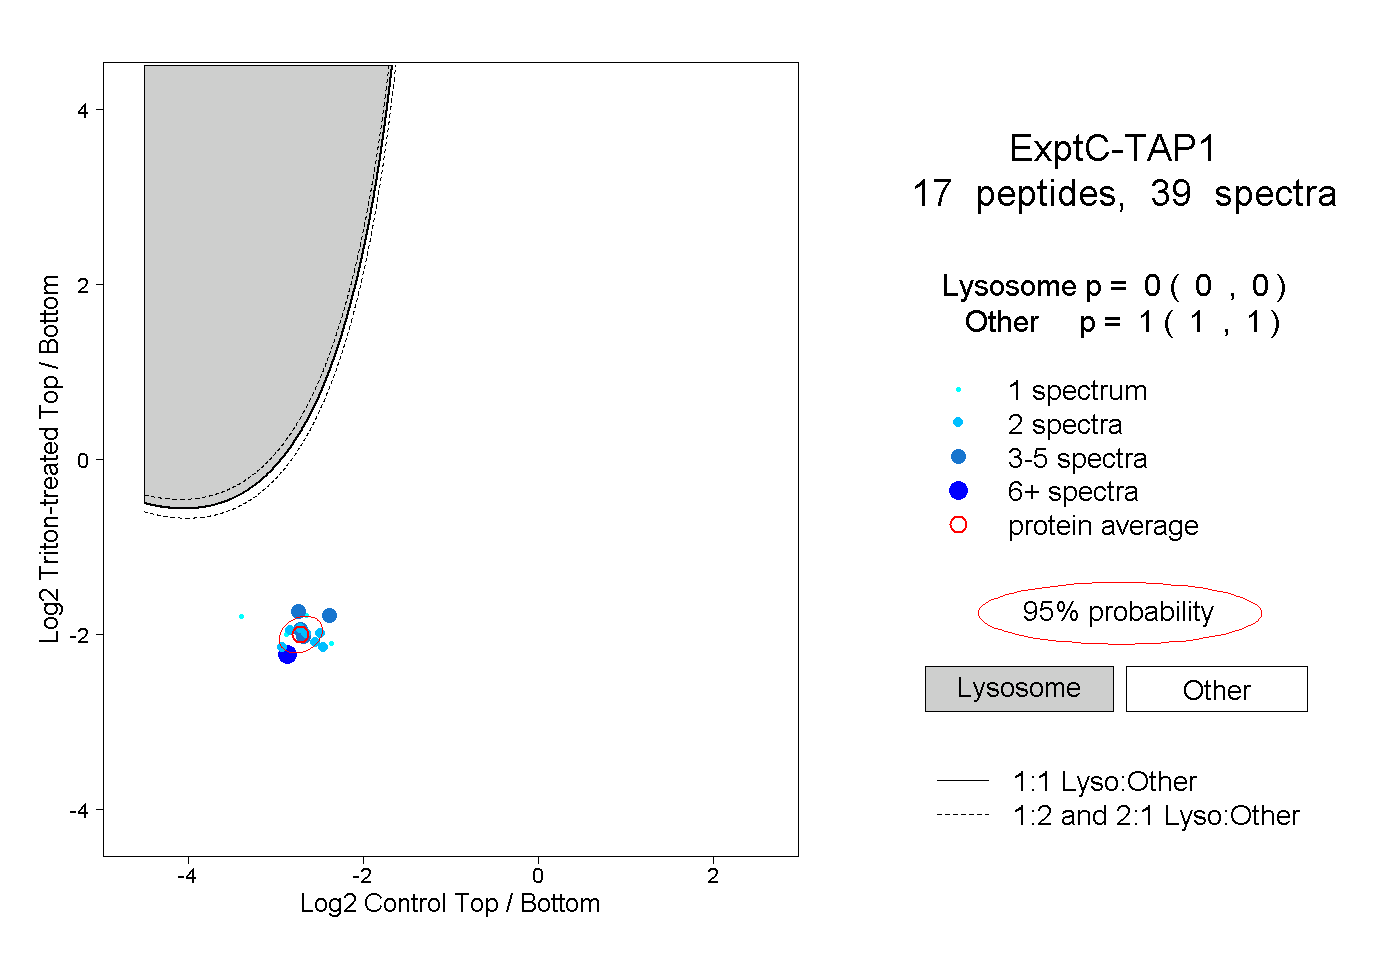 |
0.000 0.000 | 0.000 |
1.000 1.000 | 1.000 |
||||||||
| Plot | Lyso | Other | |||||||||||
| Expt D |
6 peptides |
10 spectra |
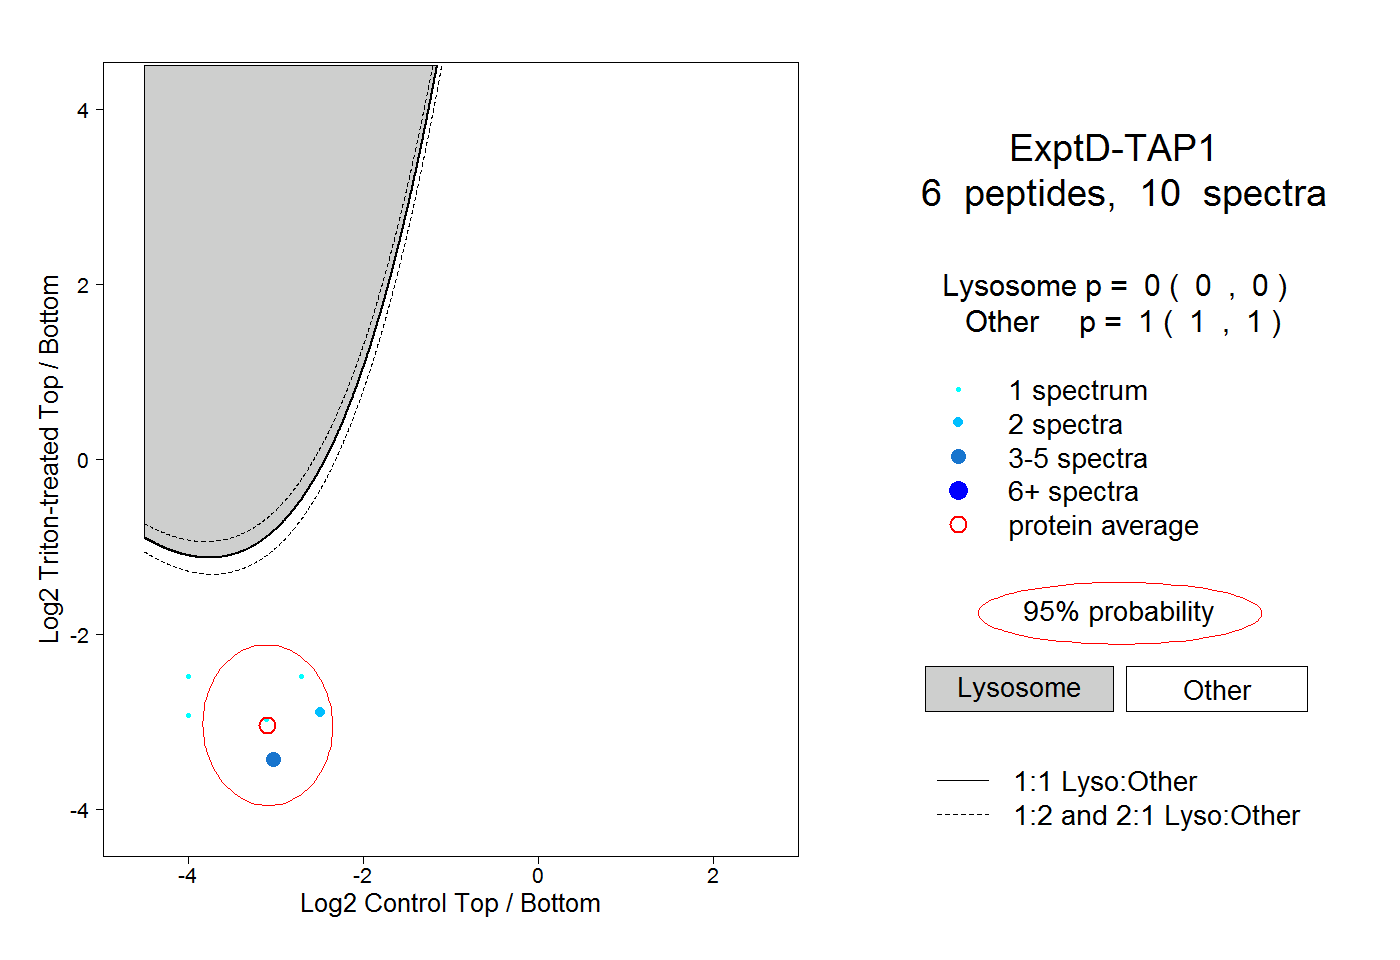 |
0.000 0.000 | 0.000 |
1.000 1.000 | 1.000 |