TAP1
[ENSRNOP00000000529]
Main page
| | | Plot |
Mito |
Lyso |
|
Perox |
ER |
Golgi |
PM |
Cytosol |
Nucleus |
|
| Expt A |
 12
12
peptides |
22
spectra |
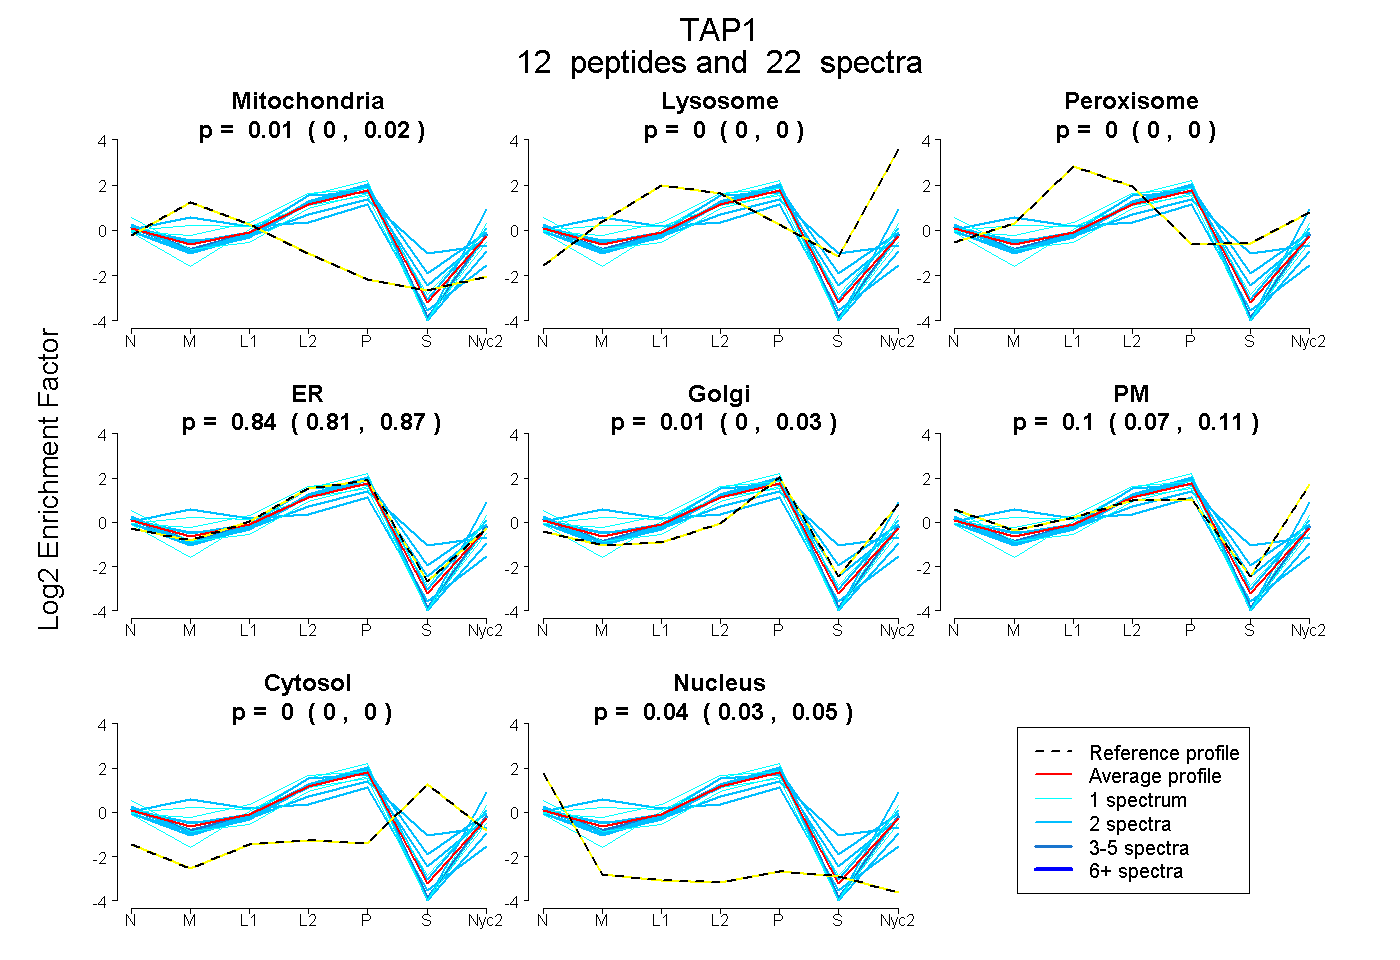 |
0.009
0.000 | 0.022 |
0.000
0.000 | 0.000 |
|
0.000
0.000 | 0.000 |
0.842
0.812 | 0.865 |
0.010
0.000 | 0.030 |
0.096
0.069 | 0.115 |
0.000
0.000 | 0.000 |
0.044
0.034 | 0.050 |
|
| | | Plot |
Mito |
|
Lyso or Perox |
|
ER |
Golgi |
PM |
Cytosol |
Nucleus |
|
| Expt B |
5
peptides |
7
spectra |
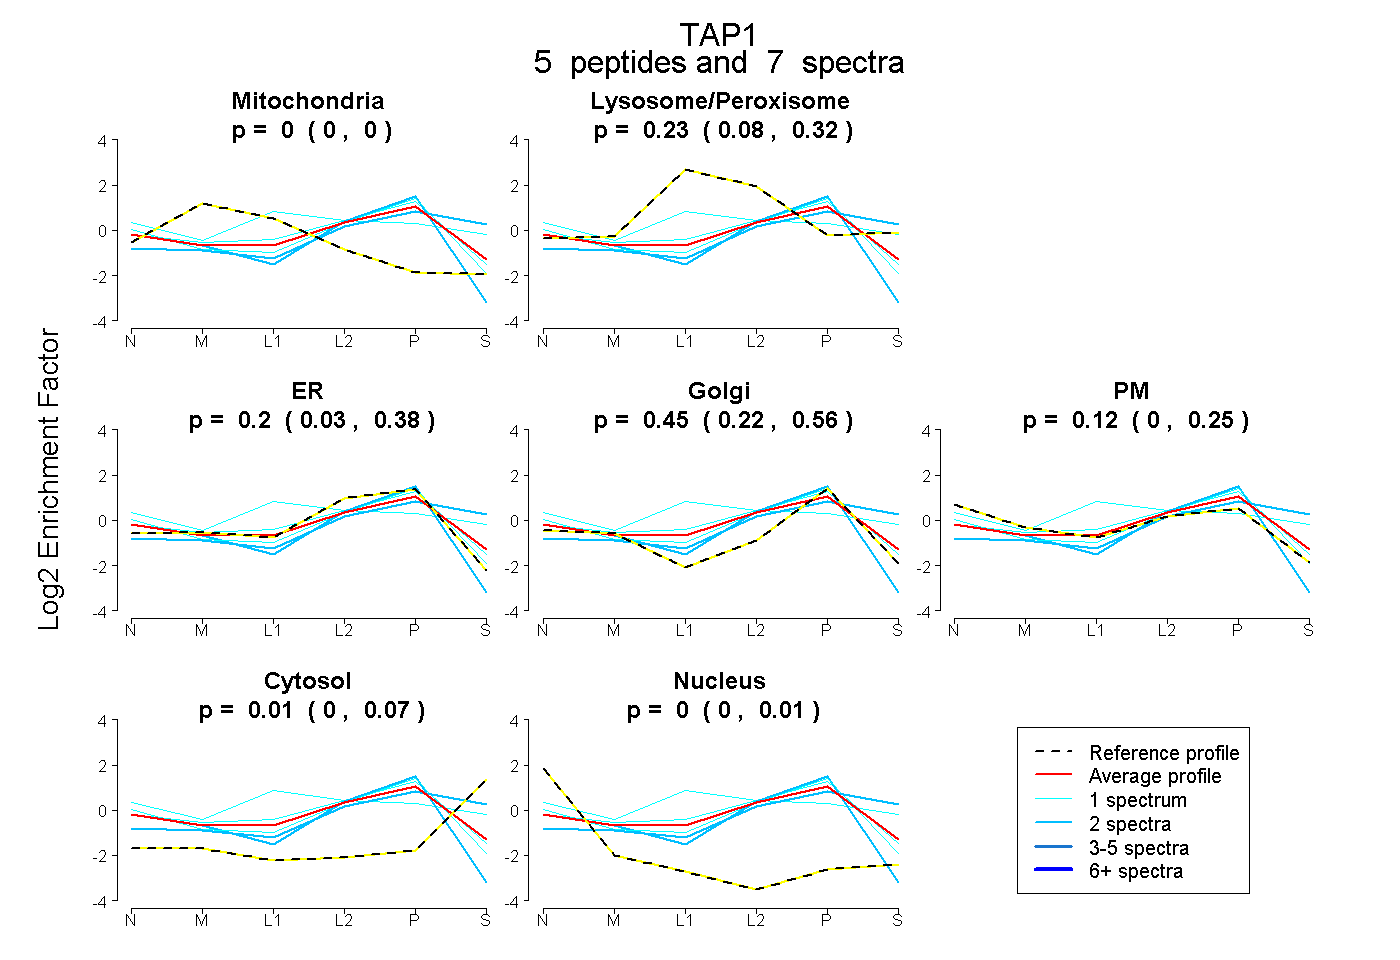 |
0.000
0.000 | 0.000 |
|
0.226
0.082 | 0.322 |
|
0.196
0.031 | 0.384 |
0.445
0.218 | 0.565 |
0.120
0.000 | 0.253 |
0.013
0.000 | 0.072 |
0.000
0.000 | 0.006 |
|
| 1 spectrum, QAVALAR |
0.000 |
|
0.002 |
|
0.489 |
0.223 |
0.286 |
0.000 |
0.000 |
|
| 2 spectra, NPTGSITSR |
0.000 |
|
0.000 |
|
0.690 |
0.270 |
0.000 |
0.000 |
0.040 |
|
| 2 spectra, VHGEVFR |
0.000 |
|
0.160 |
|
0.334 |
0.171 |
0.000 |
0.335 |
0.000 |
|
| 1 spectrum, GVLGVTAGAR |
0.000 |
|
0.220 |
|
0.338 |
0.357 |
0.085 |
0.000 |
0.000 |
|
| 1 spectrum, AVLHQETGFFLK |
0.000 |
|
0.478 |
|
0.000 |
0.000 |
0.403 |
0.119 |
0.000 |
|
| | | Plot |
|
Lyso |
|
|
|
|
|
|
|
Other |
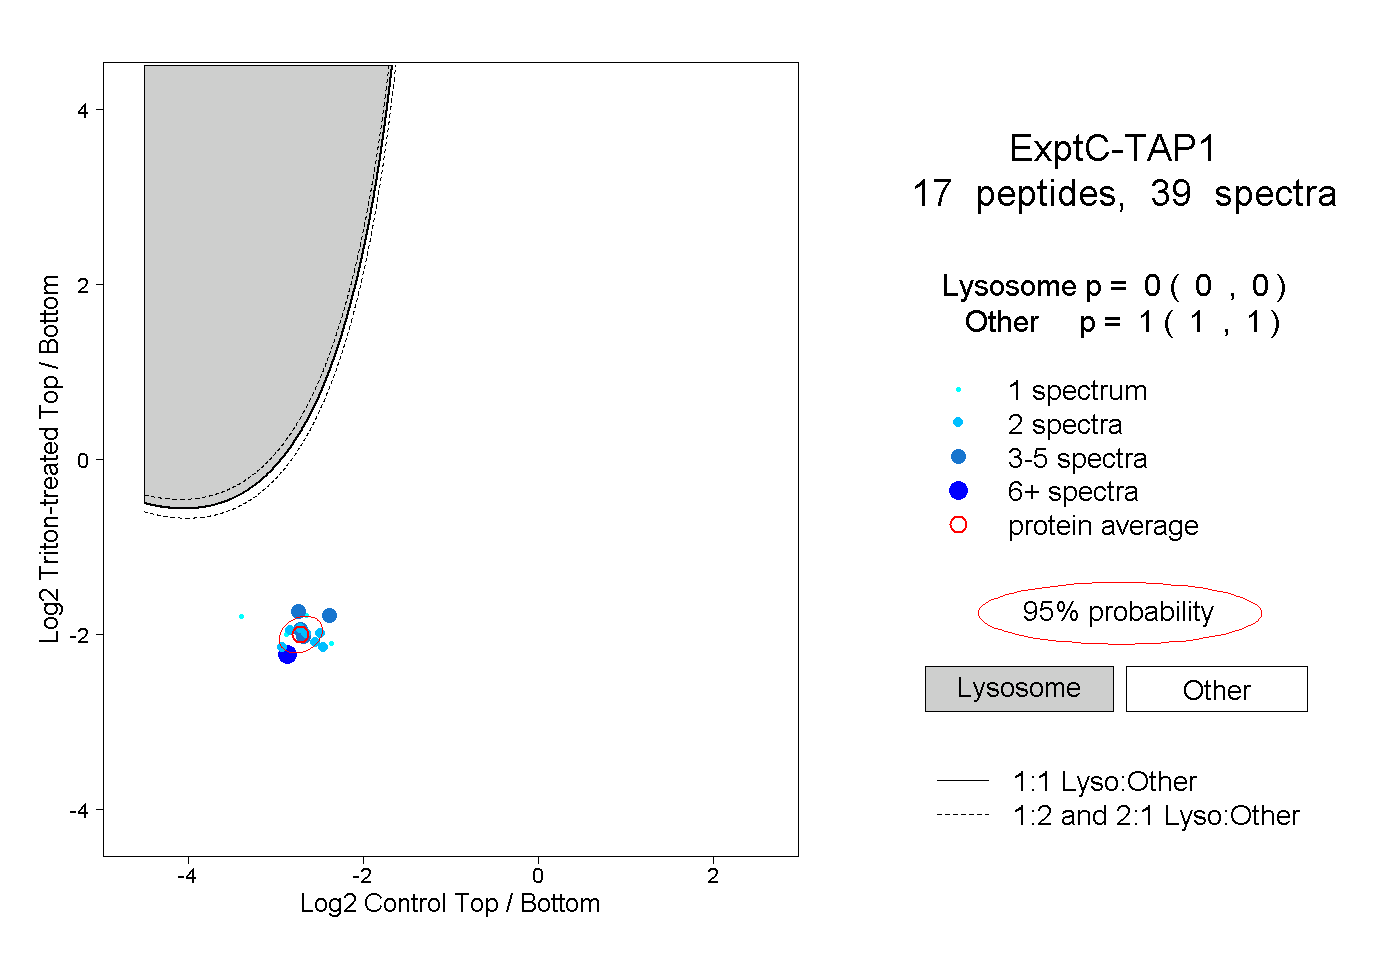
| Expt C |
17
peptides |
39
spectra |
 |
|
0.000
0.000 | 0.000 |
|
|
|
|
|
|
|
1.000
1.000 | 1.000 |
| | | Plot |
|
Lyso |
|
|
|
|
|
|
|
Other |
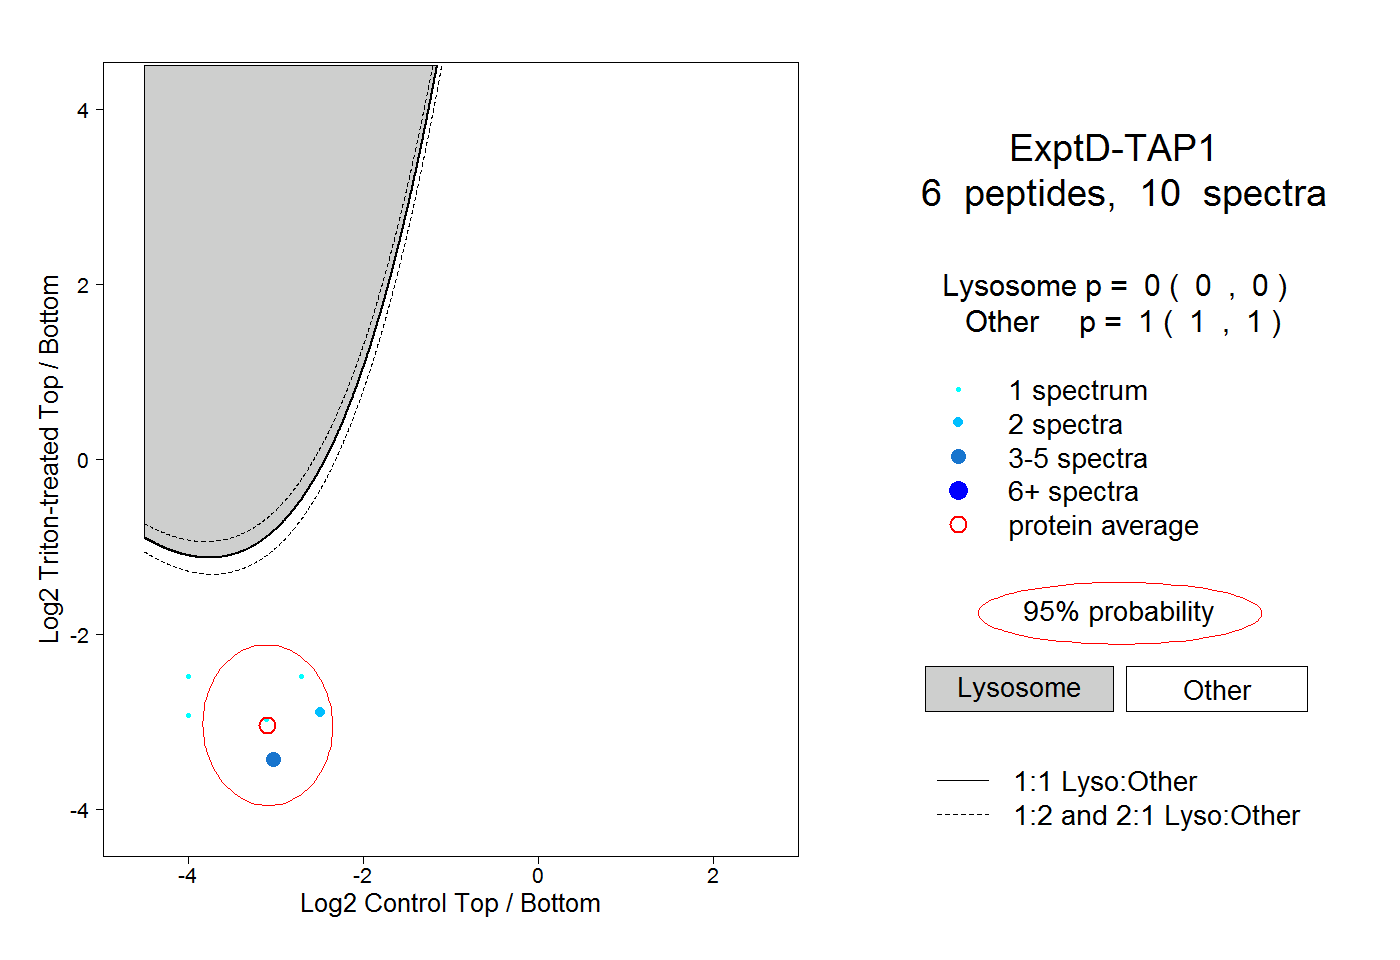
| Expt D |
6
peptides |
10
spectra |
 |
|
0.000
0.000 | 0.000 |
|
|
|
|
|
|
|
1.000
1.000 | 1.000 |