 3
3peptides
spectra
0.000 | 0.000
0.000 | 0.000
0.000 | 0.000
0.000 | 0.133
0.000 | 0.065
0.465 | 0.642
0.326 | 0.385
0.000 | 0.024
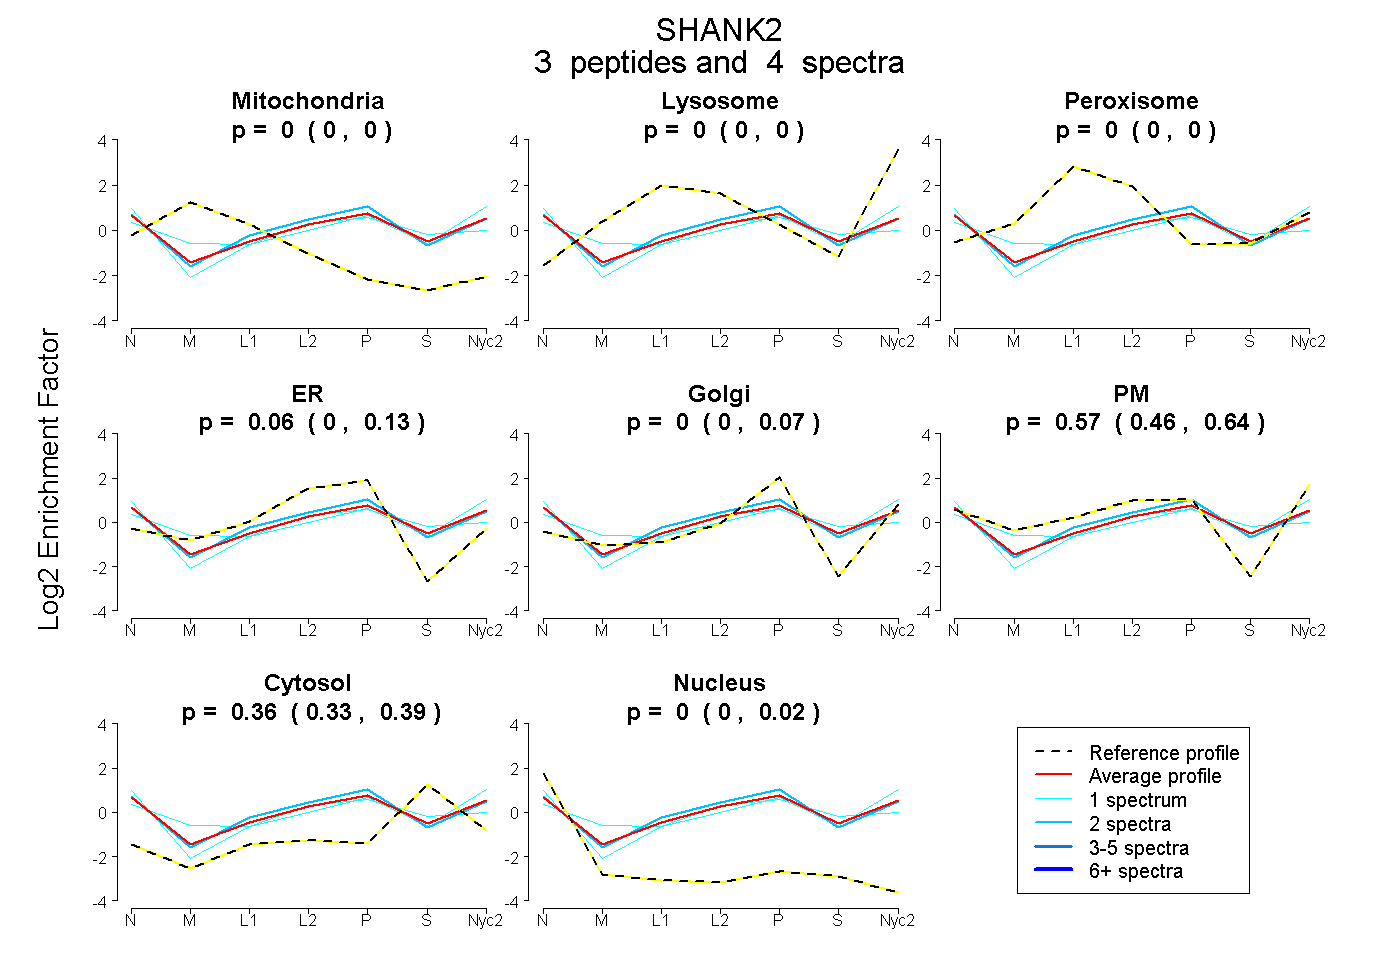
| Plot | Mito | Lyso | Perox | ER | Golgi | PM | Cytosol | Nucleus | |||||
| Expt A |
3 peptides |
4 spectra |
|
0.000 0.000 | 0.000 |
0.000 0.000 | 0.000 |
0.000 0.000 | 0.000 |
0.059 0.000 | 0.133 |
0.000 0.000 | 0.065 |
0.575 0.465 | 0.642 |
0.365 0.326 | 0.385 |
0.001 0.000 | 0.024 |
| 1 spectrum, APTTALTLR | 0.000 | 0.000 | 0.000 | 0.000 | 0.008 | 0.613 | 0.354 | 0.025 | ||
| 1 spectrum, NLDPDDTAR | 0.004 | 0.000 | 0.039 | 0.167 | 0.000 | 0.398 | 0.392 | 0.000 | ||
| 2 spectra, RPPNTLAAPR | 0.000 | 0.000 | 0.000 | 0.167 | 0.000 | 0.523 | 0.310 | 0.000 |