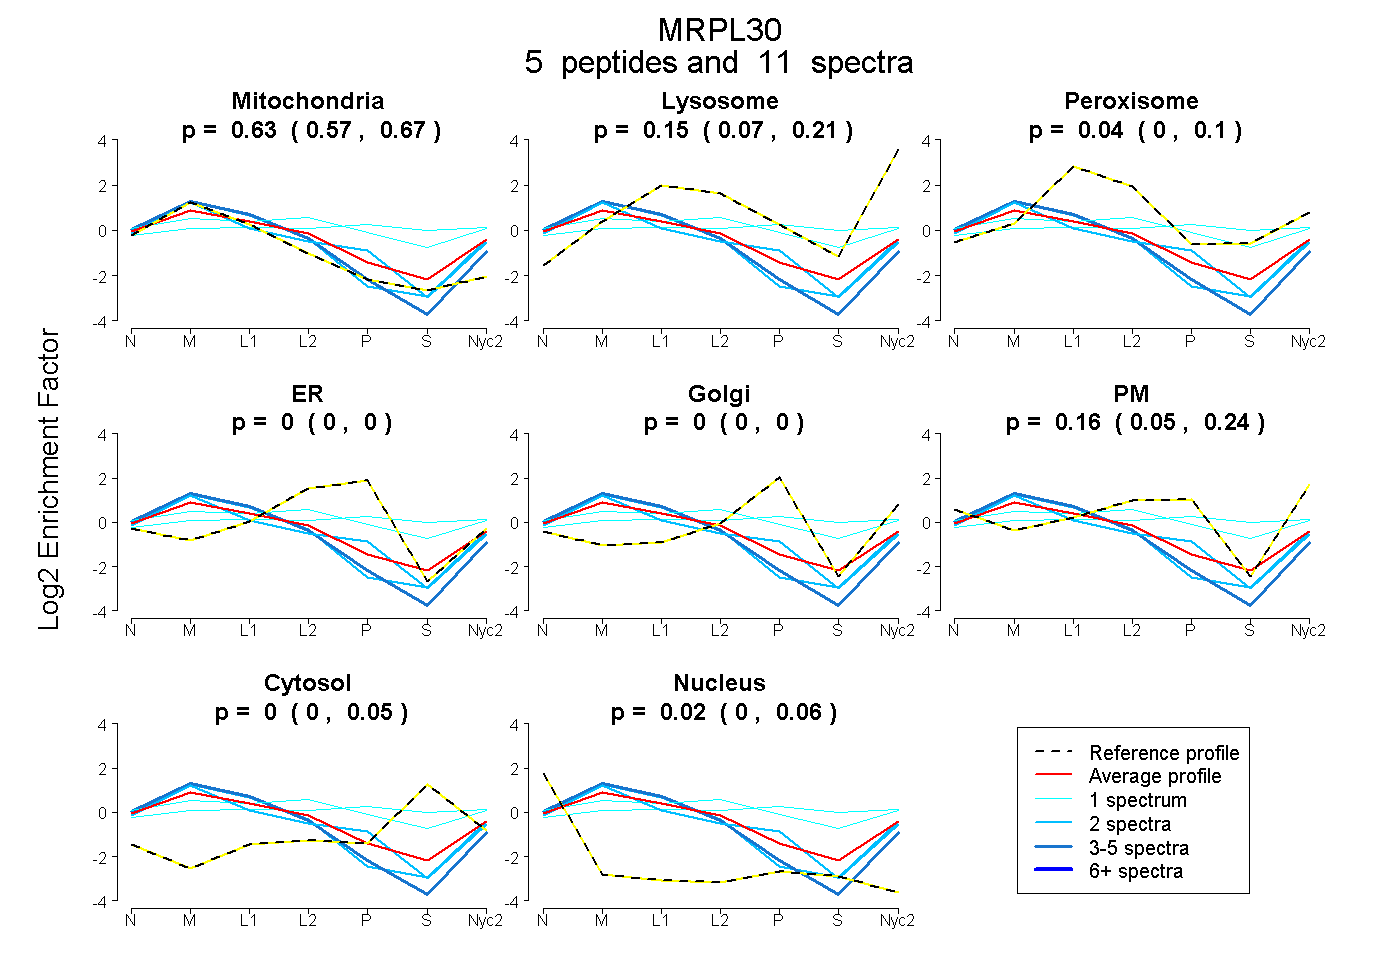
 5
5peptides
spectra
0.566 | 0.674
0.074 | 0.207
0.000 | 0.098
0.000 | 0.000
0.000 | 0.000
0.050 | 0.242
0.000 | 0.051
0.000 | 0.057
| Plot | Mito | Lyso | Perox | ER | Golgi | PM | Cytosol | Nucleus | |||||
| Expt A |
5 peptides |
11 spectra |
|
0.629 0.566 | 0.674 |
0.151 0.074 | 0.207 |
0.041 0.000 | 0.098 |
0.000 0.000 | 0.000 |
0.000 0.000 | 0.000 |
0.158 0.050 | 0.242 |
0.000 0.000 | 0.051 |
0.022 0.000 | 0.057 |
| 2 spectra, VFQPRPEDHEK | 0.655 | 0.023 | 0.000 | 0.000 | 0.040 | 0.282 | 0.000 | 0.000 | ||
| 1 spectrum, NIPSVNAK | 0.076 | 0.000 | 0.336 | 0.000 | 0.241 | 0.069 | 0.279 | 0.000 | ||
| 1 spectrum, LPQGLPTEETMSSTCLK | 0.206 | 0.000 | 0.299 | 0.006 | 0.010 | 0.323 | 0.156 | 0.000 | ||
| 5 spectra, LHIVTR | 0.834 | 0.057 | 0.000 | 0.000 | 0.000 | 0.109 | 0.000 | 0.000 | ||
| 2 spectra, AHSPQIHK | 0.804 | 0.196 | 0.000 | 0.000 | 0.000 | 0.000 | 0.000 | 0.000 |
| Plot | Lyso | Other | |||||||||||
| Expt C |
5 peptides |
28 spectra |
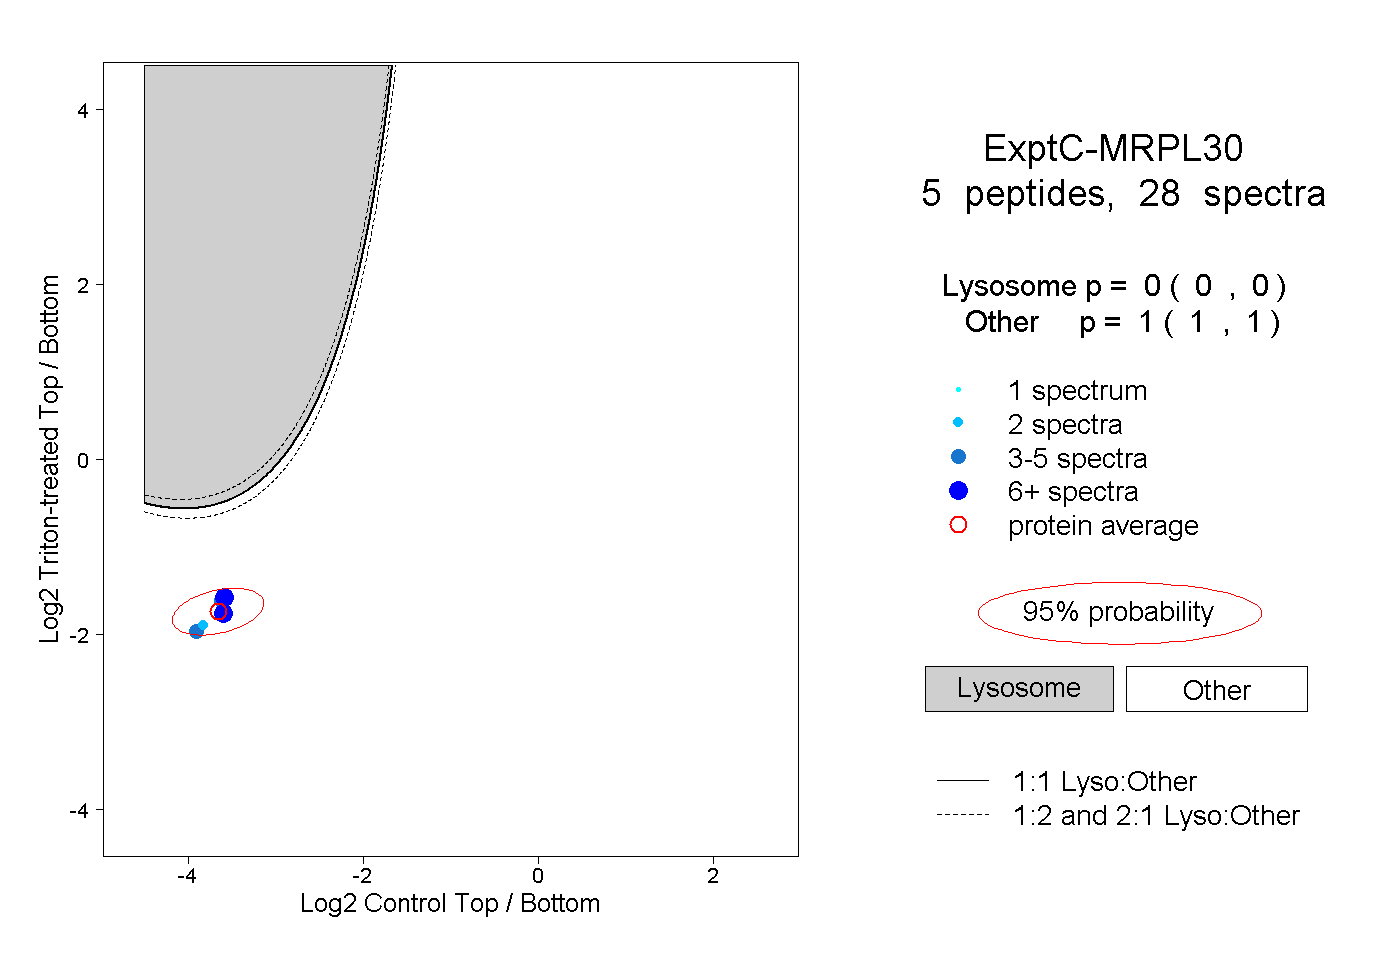 |
0.000 0.000 | 0.000 |
1.000 1.000 | 1.000 |