 1
1peptide
spectra
0.000 | 0.000
0.122 | 0.363
0.000 | 0.080
0.000 | 0.239
0.000 | 0.099
0.139 | 0.583
0.157 | 0.215
0.000 | 0.000
2peptides
spectra
0.000 | 0.000
1.000 | 1.000
| Plot | Mito | Lyso | Perox | ER | Golgi | PM | Cytosol | Nucleus | |||||
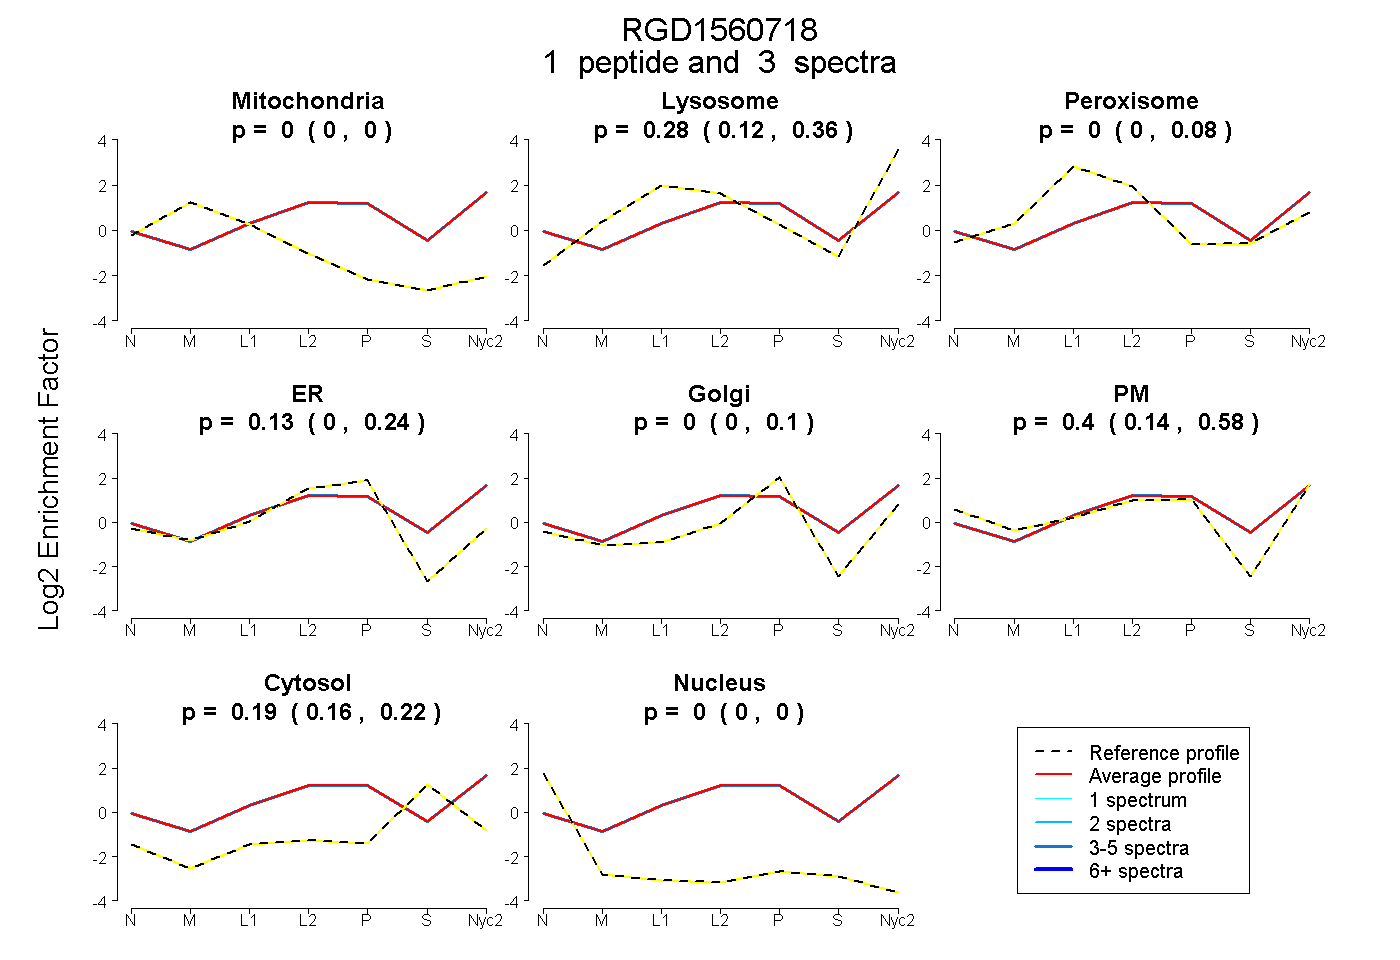
| Expt A |
1 peptide |
3 spectra |
|
0.000 0.000 | 0.000 |
0.282 0.122 | 0.363 |
0.000 0.000 | 0.080 |
0.126 0.000 | 0.239 |
0.000 0.000 | 0.099 |
0.399 0.139 | 0.583 |
0.194 0.157 | 0.215 |
0.000 0.000 | 0.000 |
||
| Plot | Lyso | Other | |||||||||||
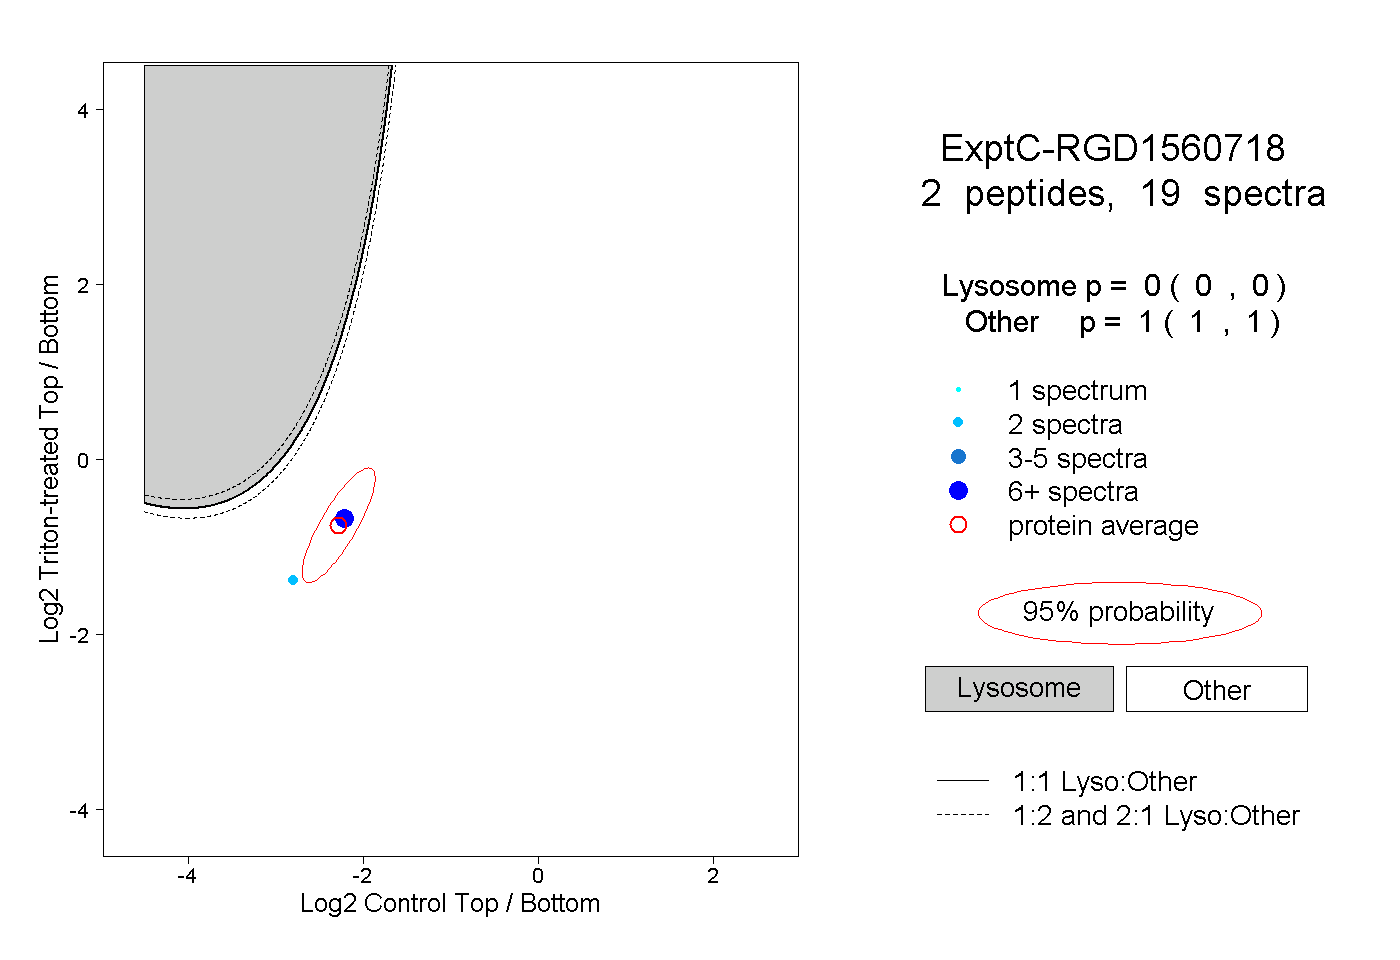
| Expt C |
2 peptides |
19 spectra |
|
0.000 0.000 | 0.000 |
1.000 1.000 | 1.000 |