 15
15peptides
spectra
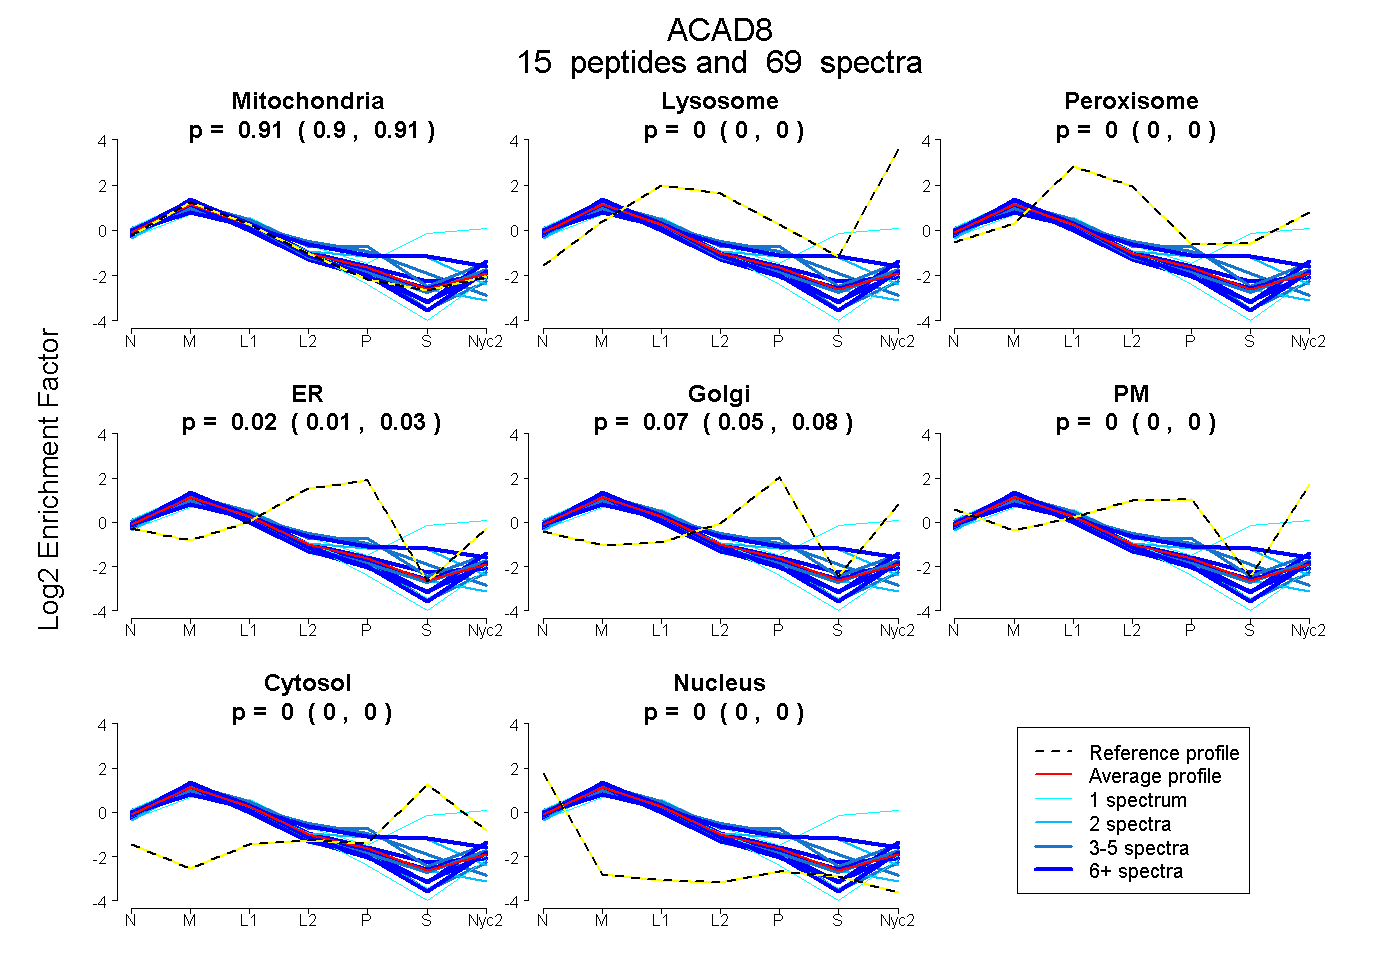
0.903 | 0.911
0.000 | 0.000
0.000 | 0.000
0.014 | 0.034
0.054 | 0.076
0.000 | 0.000
0.000 | 0.000
0.000 | 0.002
8peptides
spectra
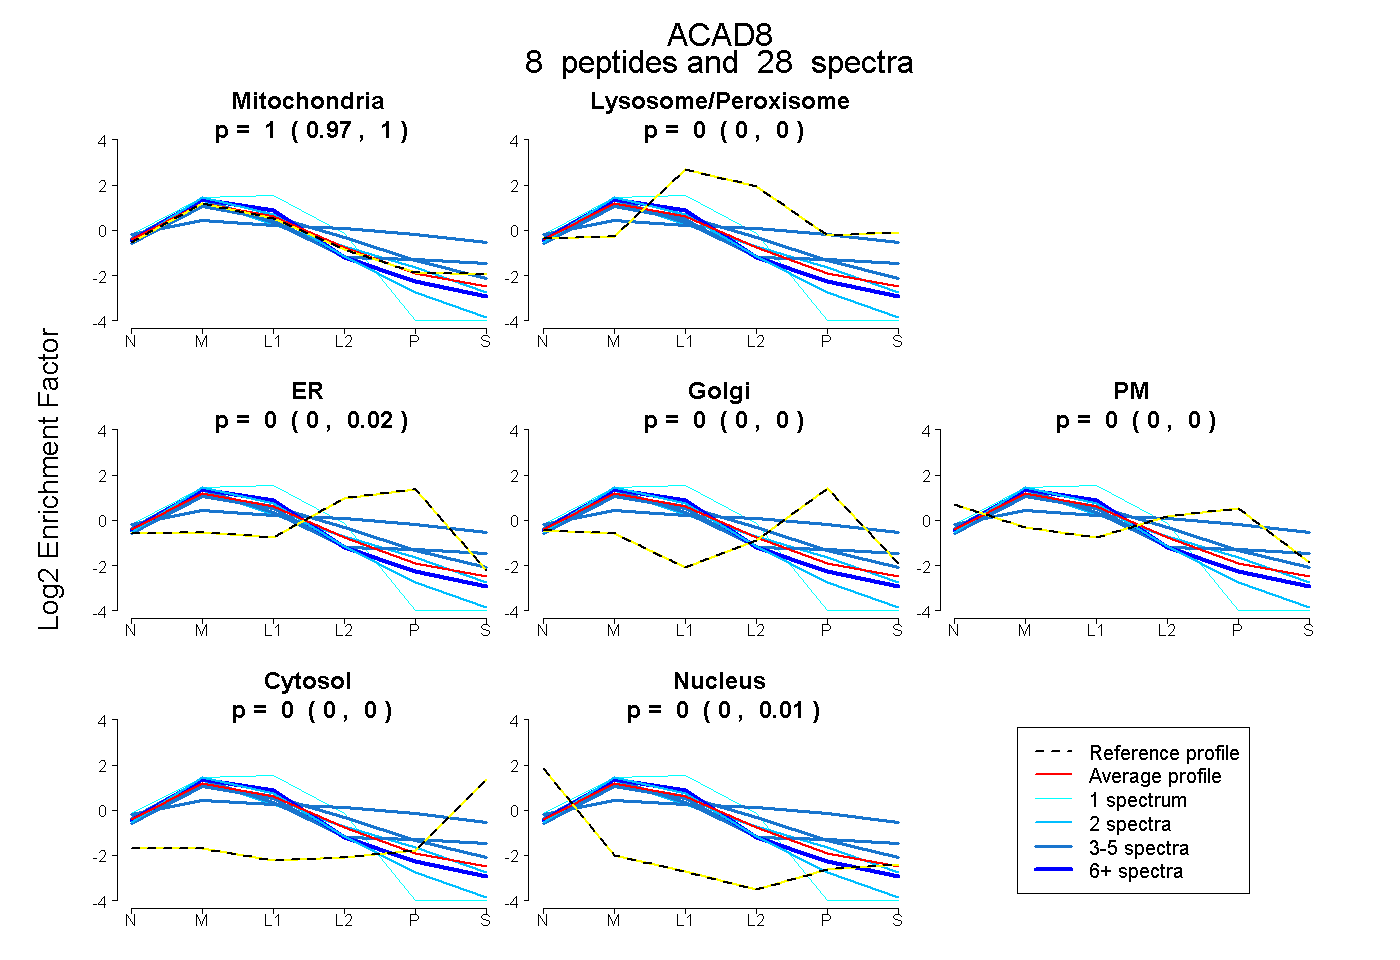
0.968 | 1.000
0.000 | 0.000
0.000 | 0.024
0.000 | 0.000
0.000 | 0.000
0.000 | 0.000
0.000 | 0.010
15peptides
spectra
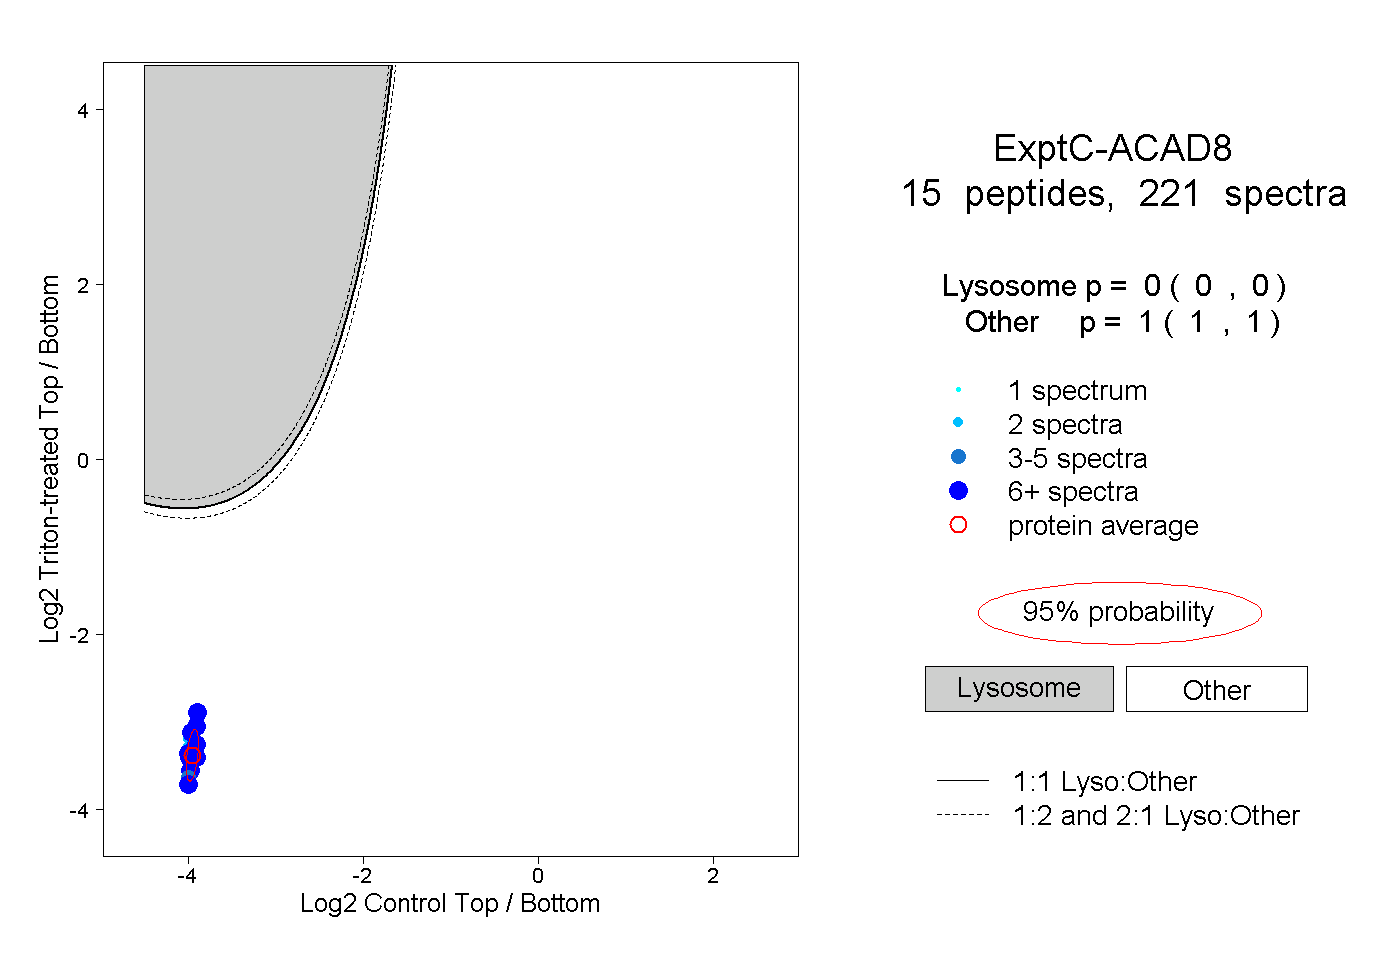
0.000 | 0.000
1.000 | 1.000
9peptides
spectra
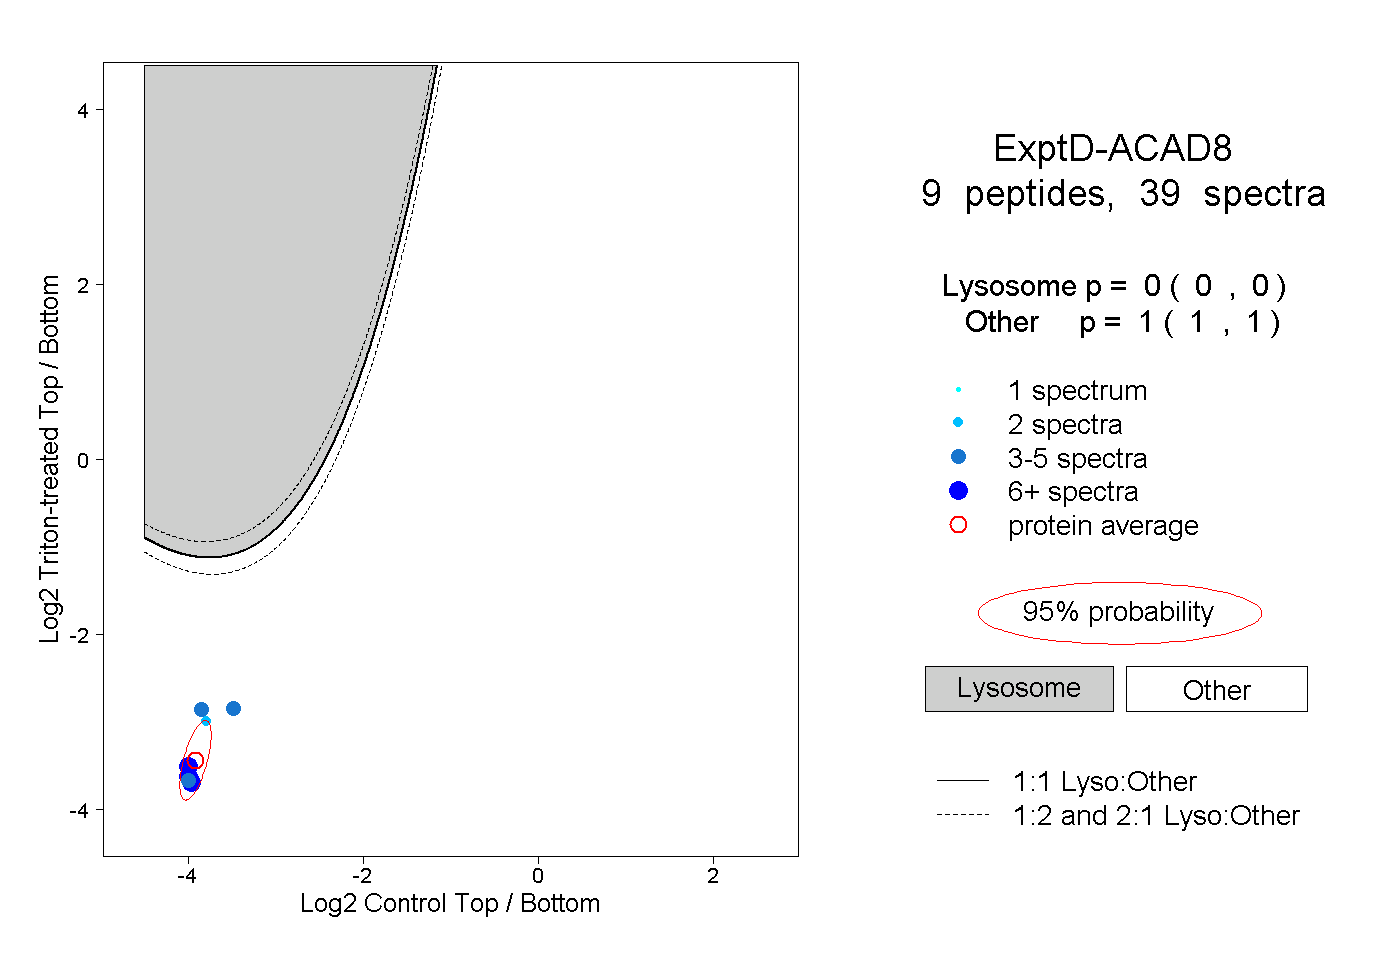
0.000 | 0.000
1.000 | 1.000