ACAD8
[ENSRNOP00000067711]
Main page
| | | Plot |
Mito |
Lyso |
|
Perox |
ER |
Golgi |
PM |
Cytosol |
Nucleus |
|
| Expt A |
 15
15
peptides |
69
spectra |
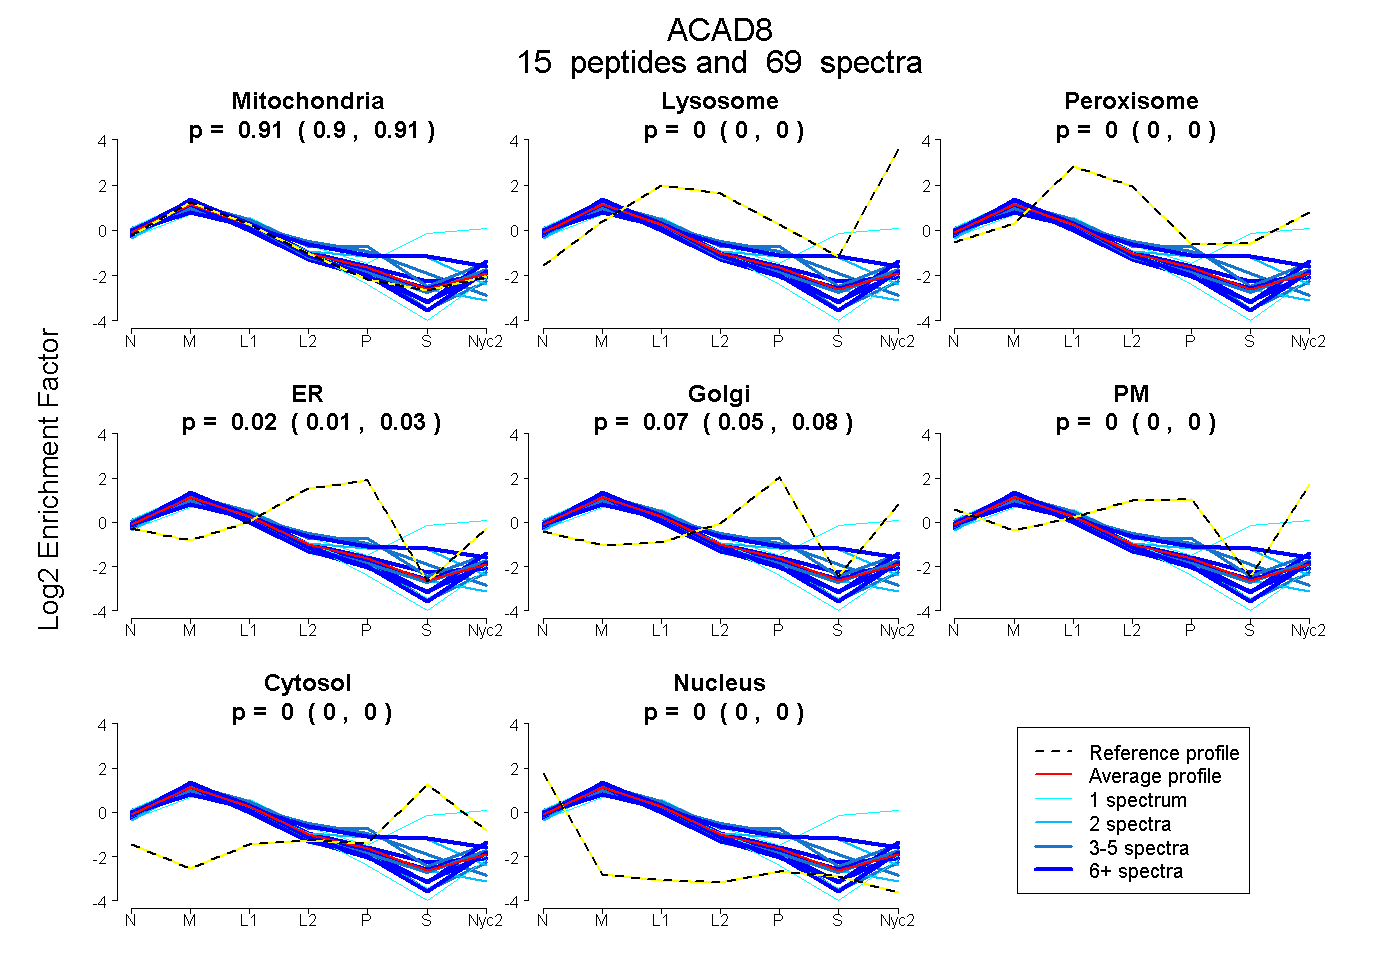 |
0.908
0.903 | 0.911 |
0.000
0.000 | 0.000 |
|
0.000
0.000 | 0.000 |
0.025
0.014 | 0.034 |
0.067
0.054 | 0.076 |
0.000
0.000 | 0.000 |
0.000
0.000 | 0.000 |
0.000
0.000 | 0.002 |
|
| | | Plot |
Mito |
|
Lyso or Perox |
|
ER |
Golgi |
PM |
Cytosol |
Nucleus |
|
| Expt B |
8
peptides |
28
spectra |
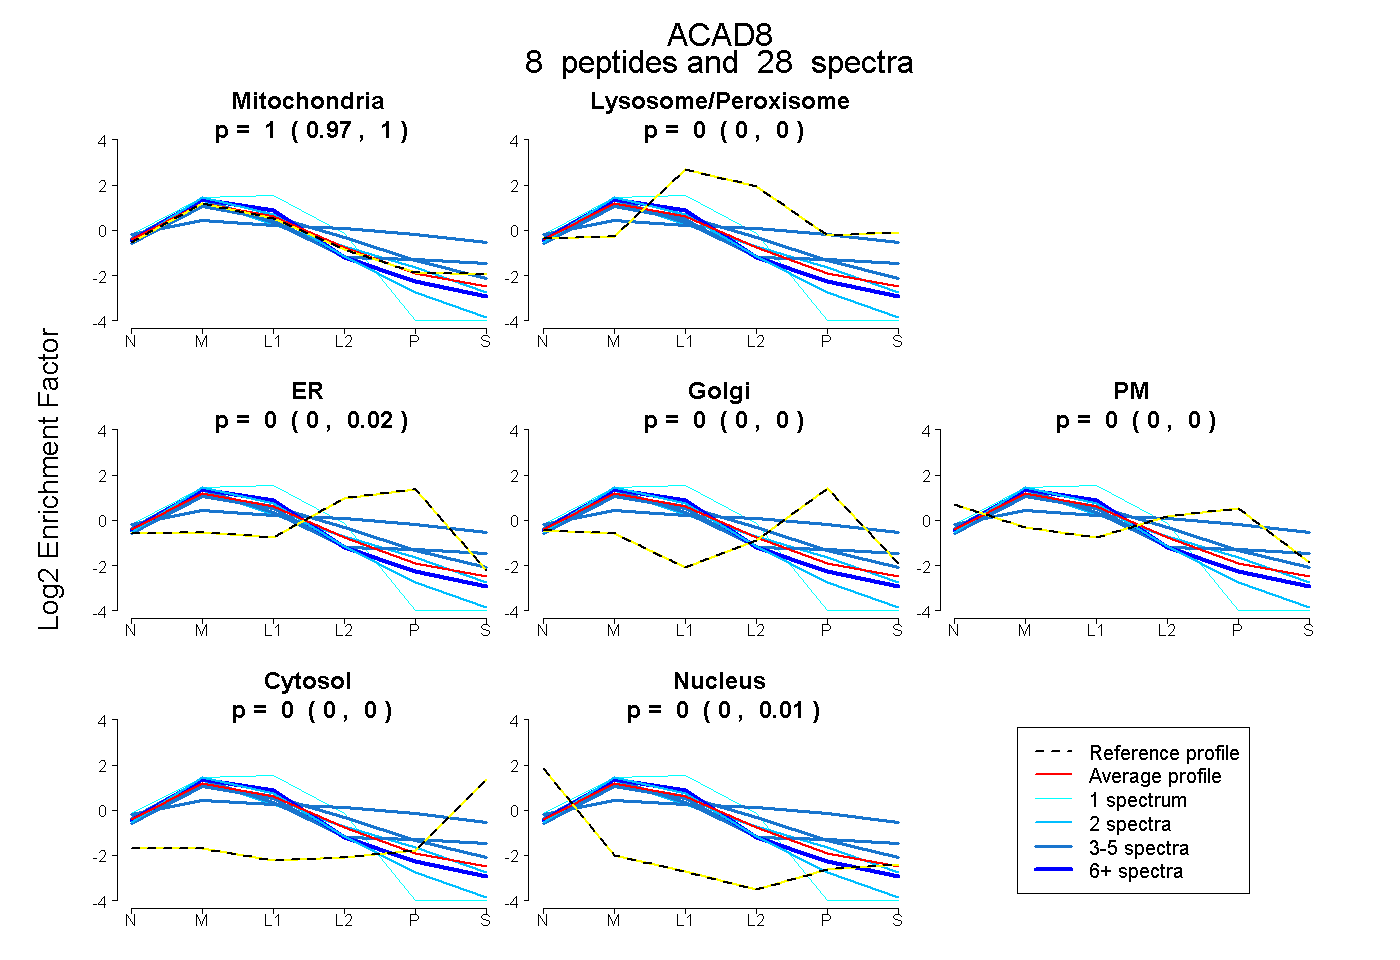 |
0.996
0.968 | 1.000 |
|
0.000
0.000 | 0.000 |
|
0.002
0.000 | 0.024 |
0.000
0.000 | 0.000 |
0.000
0.000 | 0.000 |
0.000
0.000 | 0.000 |
0.002
0.000 | 0.010 |
|
| 4 spectra, QFGAPLAR |
0.840 |
|
0.033 |
|
0.000 |
0.069 |
0.000 |
0.058 |
0.000 |
|
| 1 spectrum, AAQLGFGGIYVR |
1.000 |
|
0.000 |
|
0.000 |
0.000 |
0.000 |
0.000 |
0.000 |
|
| 4 spectra, IGTEGQGFLIAMK |
0.234 |
|
0.335 |
|
0.000 |
0.157 |
0.173 |
0.100 |
0.000 |
|
| 8 spectra, VAFDFAAR |
0.993 |
|
0.000 |
|
0.000 |
0.000 |
0.000 |
0.000 |
0.007 |
|
| 2 spectra, GISCIVVEK |
0.923 |
|
0.000 |
|
0.068 |
0.000 |
0.000 |
0.000 |
0.009 |
|
| 3 spectra, GTPGLSFGK |
0.827 |
|
0.056 |
|
0.117 |
0.000 |
0.000 |
0.000 |
0.000 |
|
| 2 spectra, VGWNSQPTR |
0.975 |
|
0.000 |
|
0.000 |
0.000 |
0.000 |
0.000 |
0.025 |
|
| 4 spectra, TDVGGSGLSR |
0.938 |
|
0.000 |
|
0.000 |
0.000 |
0.000 |
0.000 |
0.062 |
|
| | | Plot |
|
Lyso |
|
|
|
|
|
|
|
Other |
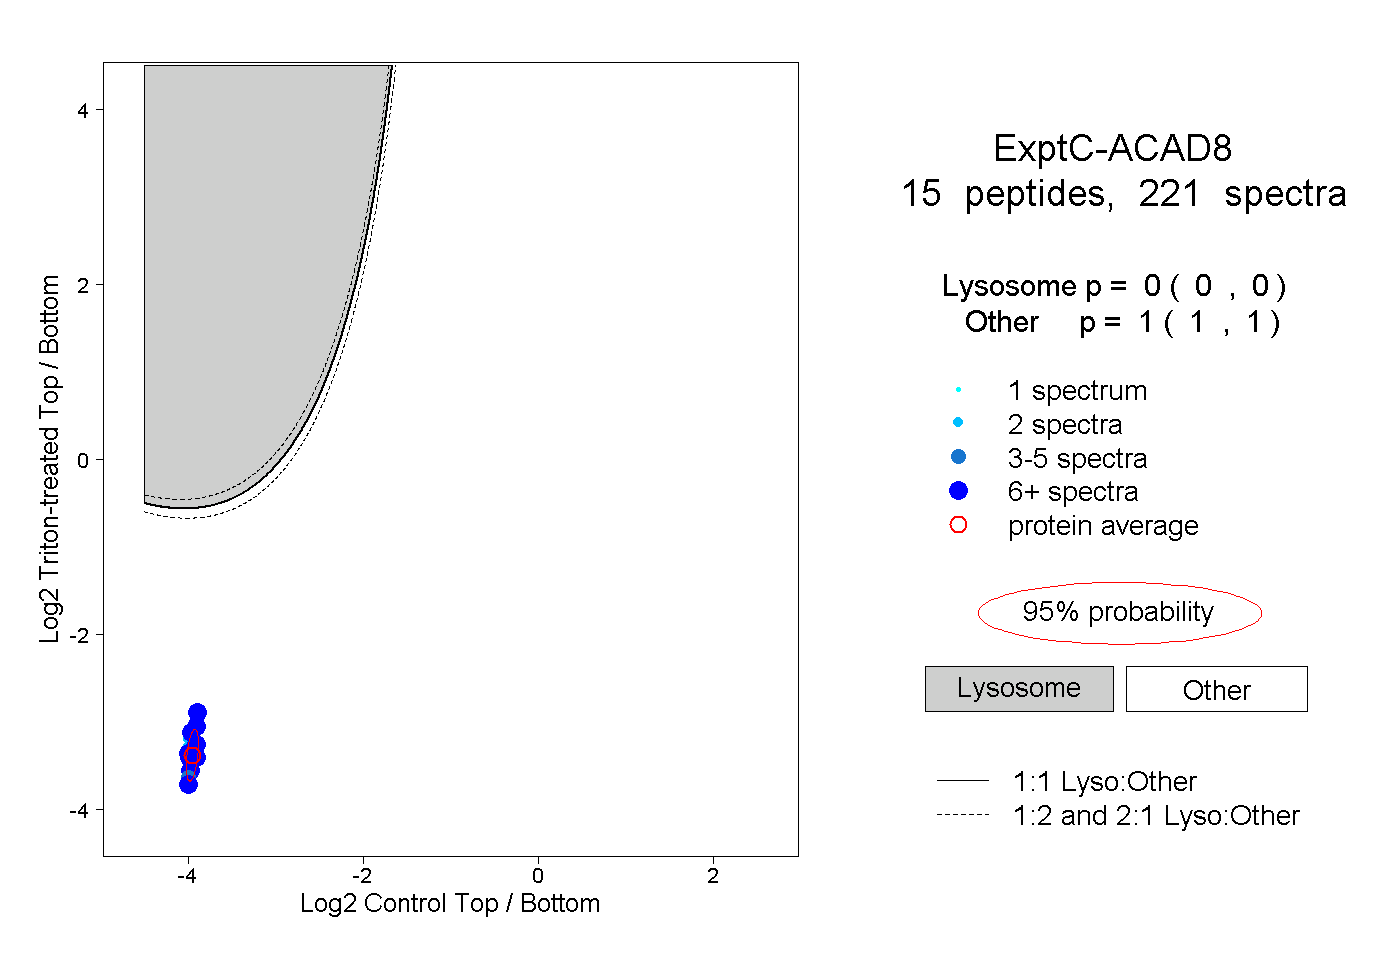
| Expt C |
15
peptides |
221
spectra |
 |
|
0.000
0.000 | 0.000 |
|
|
|
|
|
|
|
1.000
1.000 | 1.000 |
| | | Plot |
|
Lyso |
|
|
|
|
|
|
|
Other |
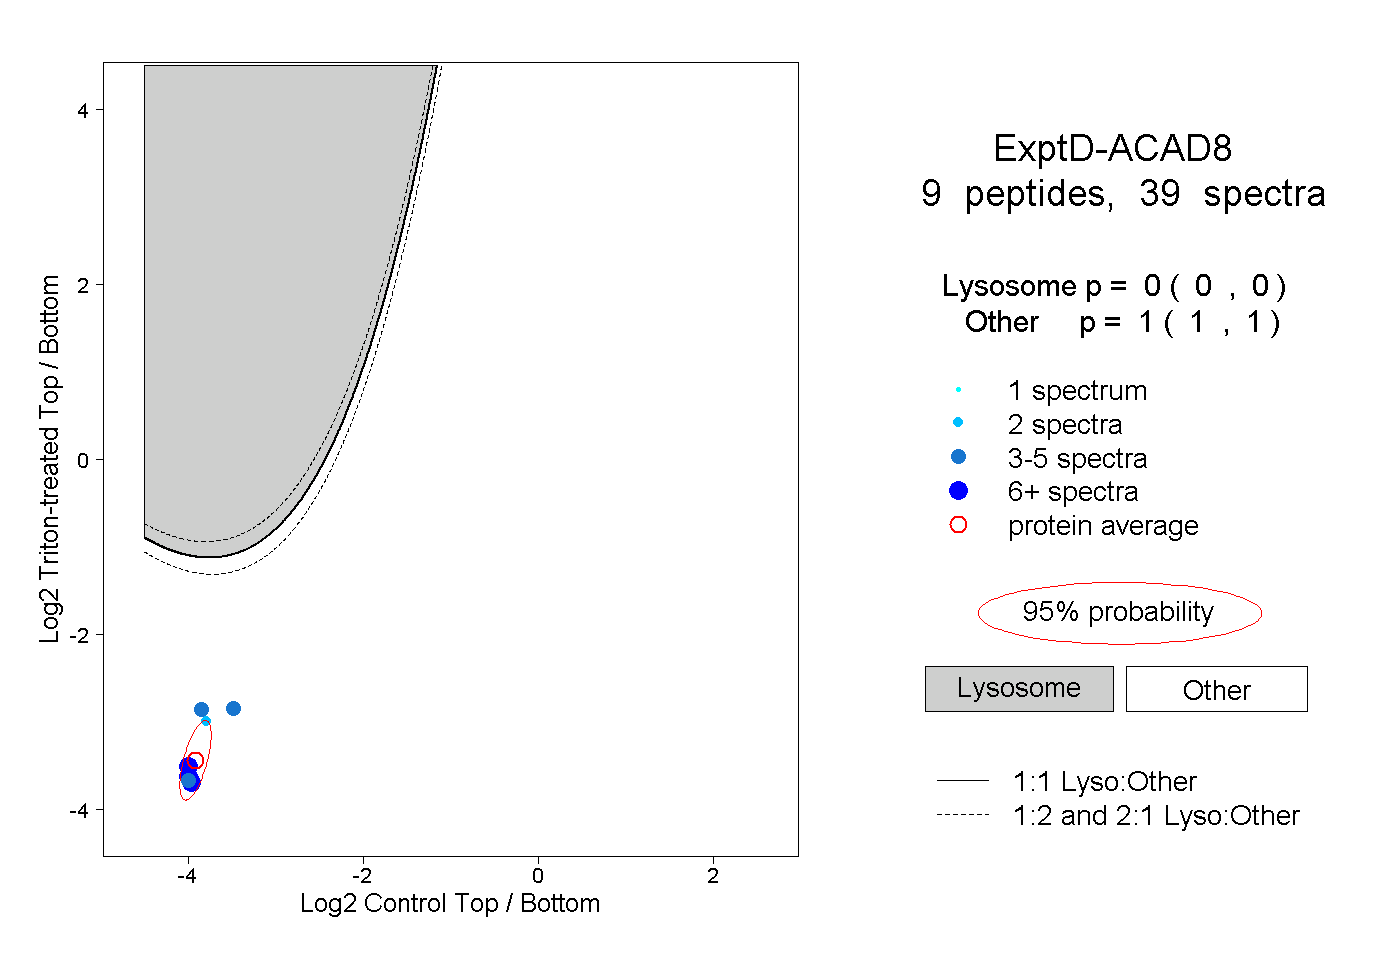
| Expt D |
9
peptides |
39
spectra |
 |
|
0.000
0.000 | 0.000 |
|
|
|
|
|
|
|
1.000
1.000 | 1.000 |