 15
15peptides
spectra
0.903 | 0.911
0.000 | 0.000
0.000 | 0.000
0.014 | 0.034
0.054 | 0.076
0.000 | 0.000
0.000 | 0.000
0.000 | 0.002
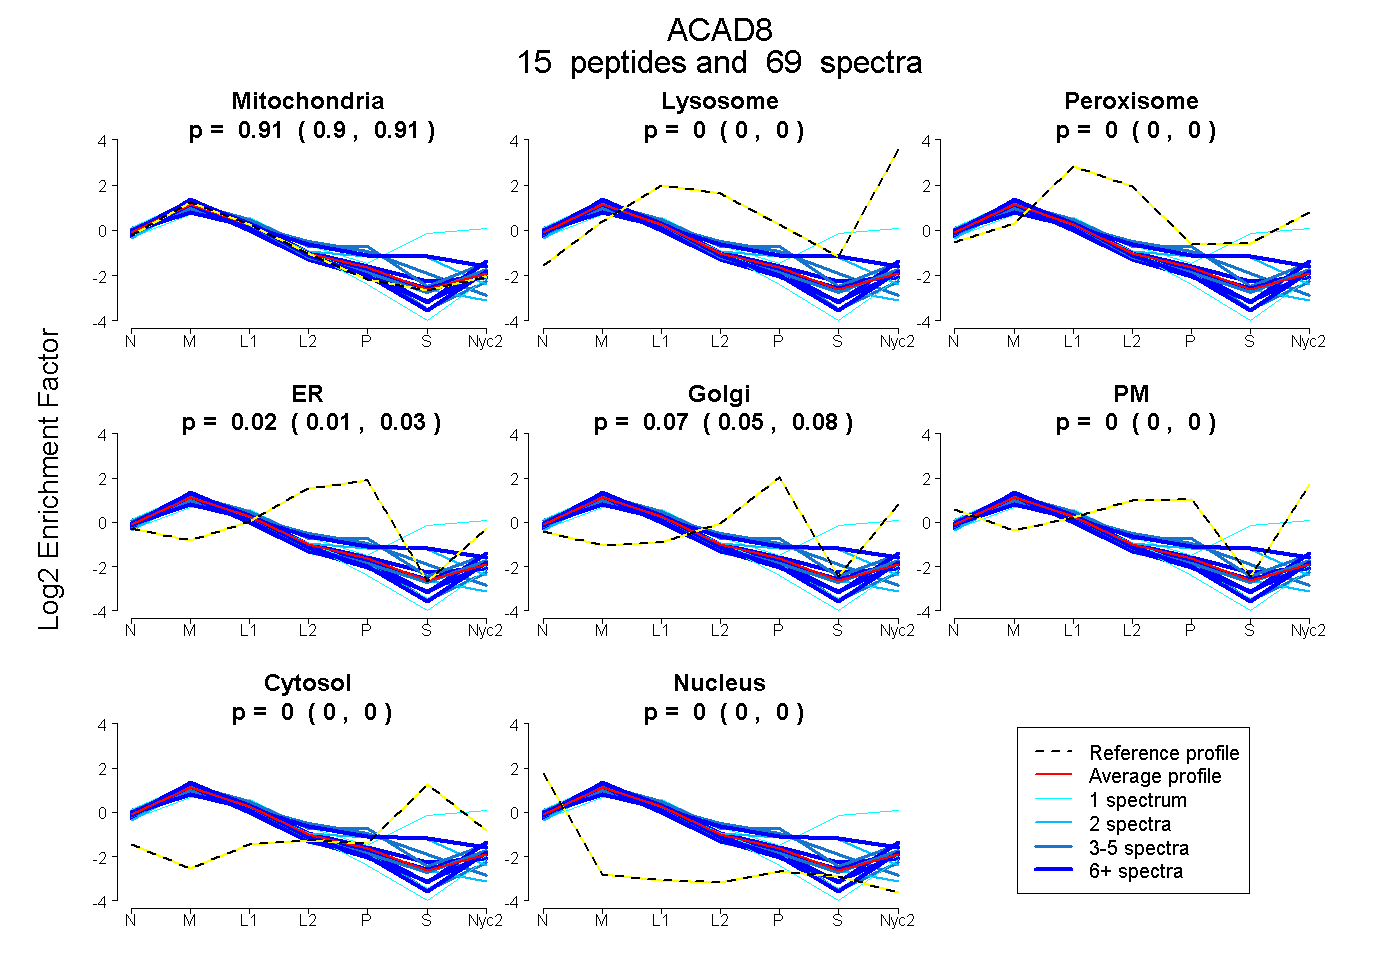
| Plot | Mito | Lyso | Perox | ER | Golgi | PM | Cytosol | Nucleus | |||||
| Expt A |
15 peptides |
69 spectra |
|
0.908 0.903 | 0.911 |
0.000 0.000 | 0.000 |
0.000 0.000 | 0.000 |
0.025 0.014 | 0.034 |
0.067 0.054 | 0.076 |
0.000 0.000 | 0.000 |
0.000 0.000 | 0.000 |
0.000 0.000 | 0.002 |
| 6 spectra, QFGAPLAR | 0.879 | 0.000 | 0.000 | 0.000 | 0.025 | 0.096 | 0.000 | 0.000 | ||
| 7 spectra, ELFPVDVMR | 0.988 | 0.000 | 0.000 | 0.000 | 0.012 | 0.000 | 0.000 | 0.000 | ||
| 5 spectra, AAQLGFGGIYVR | 0.938 | 0.000 | 0.000 | 0.045 | 0.000 | 0.000 | 0.000 | 0.017 | ||
| 2 spectra, FCPPLCTMEK | 0.761 | 0.000 | 0.029 | 0.045 | 0.000 | 0.000 | 0.165 | 0.000 | ||
| 1 spectrum, IGTEGQGFLIAMK | 0.968 | 0.000 | 0.000 | 0.000 | 0.000 | 0.000 | 0.000 | 0.032 | ||
| 5 spectra, VAFDFAAR | 0.920 | 0.000 | 0.000 | 0.000 | 0.019 | 0.052 | 0.000 | 0.010 | ||
| 4 spectra, GISCIVVEK | 0.709 | 0.000 | 0.052 | 0.108 | 0.131 | 0.000 | 0.000 | 0.000 | ||
| 6 spectra, GTPGLSFGK | 0.624 | 0.000 | 0.117 | 0.083 | 0.000 | 0.000 | 0.177 | 0.000 | ||
| 2 spectra, AVIFEDCAVPVANR | 0.946 | 0.000 | 0.000 | 0.000 | 0.000 | 0.000 | 0.000 | 0.054 | ||
| 13 spectra, VGWNSQPTR | 0.963 | 0.000 | 0.000 | 0.000 | 0.000 | 0.033 | 0.000 | 0.004 | ||
| 7 spectra, EMAPNMAEWDQK | 0.864 | 0.000 | 0.024 | 0.069 | 0.000 | 0.000 | 0.025 | 0.018 | ||
| 1 spectrum, TGGSGPK | 0.958 | 0.000 | 0.000 | 0.031 | 0.000 | 0.007 | 0.000 | 0.003 | ||
| 6 spectra, TDVGGSGLSR | 0.901 | 0.000 | 0.000 | 0.000 | 0.062 | 0.000 | 0.000 | 0.036 | ||
| 3 spectra, AFISGGGESDIYVVMCR | 0.771 | 0.000 | 0.000 | 0.168 | 0.000 | 0.000 | 0.039 | 0.022 | ||
| 1 spectrum, FASYCLTEPGSGSDAASLLTSAK | 0.385 | 0.174 | 0.171 | 0.000 | 0.000 | 0.000 | 0.270 | 0.000 |
| Plot | Mito | Lyso or Perox | ER | Golgi | PM | Cytosol | Nucleus | ||||||
| Expt B |
8 peptides |
28 spectra |
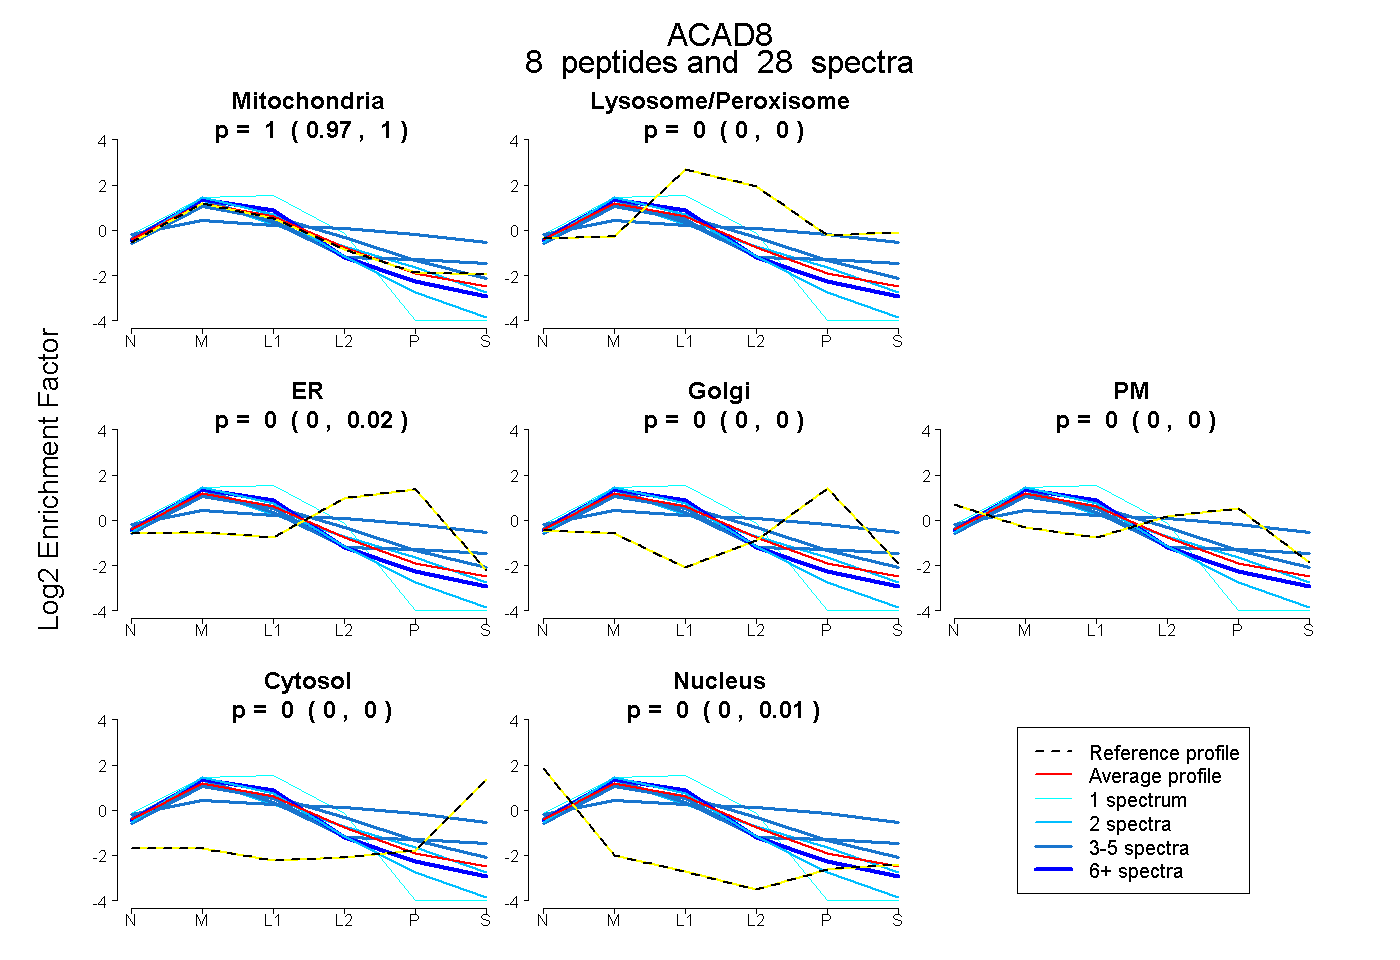 |
0.996 0.968 | 1.000 |
0.000 0.000 | 0.000 |
0.002 0.000 | 0.024 |
0.000 0.000 | 0.000 |
0.000 0.000 | 0.000 |
0.000 0.000 | 0.000 |
0.002 0.000 | 0.010 |
|||
| Plot | Lyso | Other | |||||||||||
| Expt C |
15 peptides |
221 spectra |
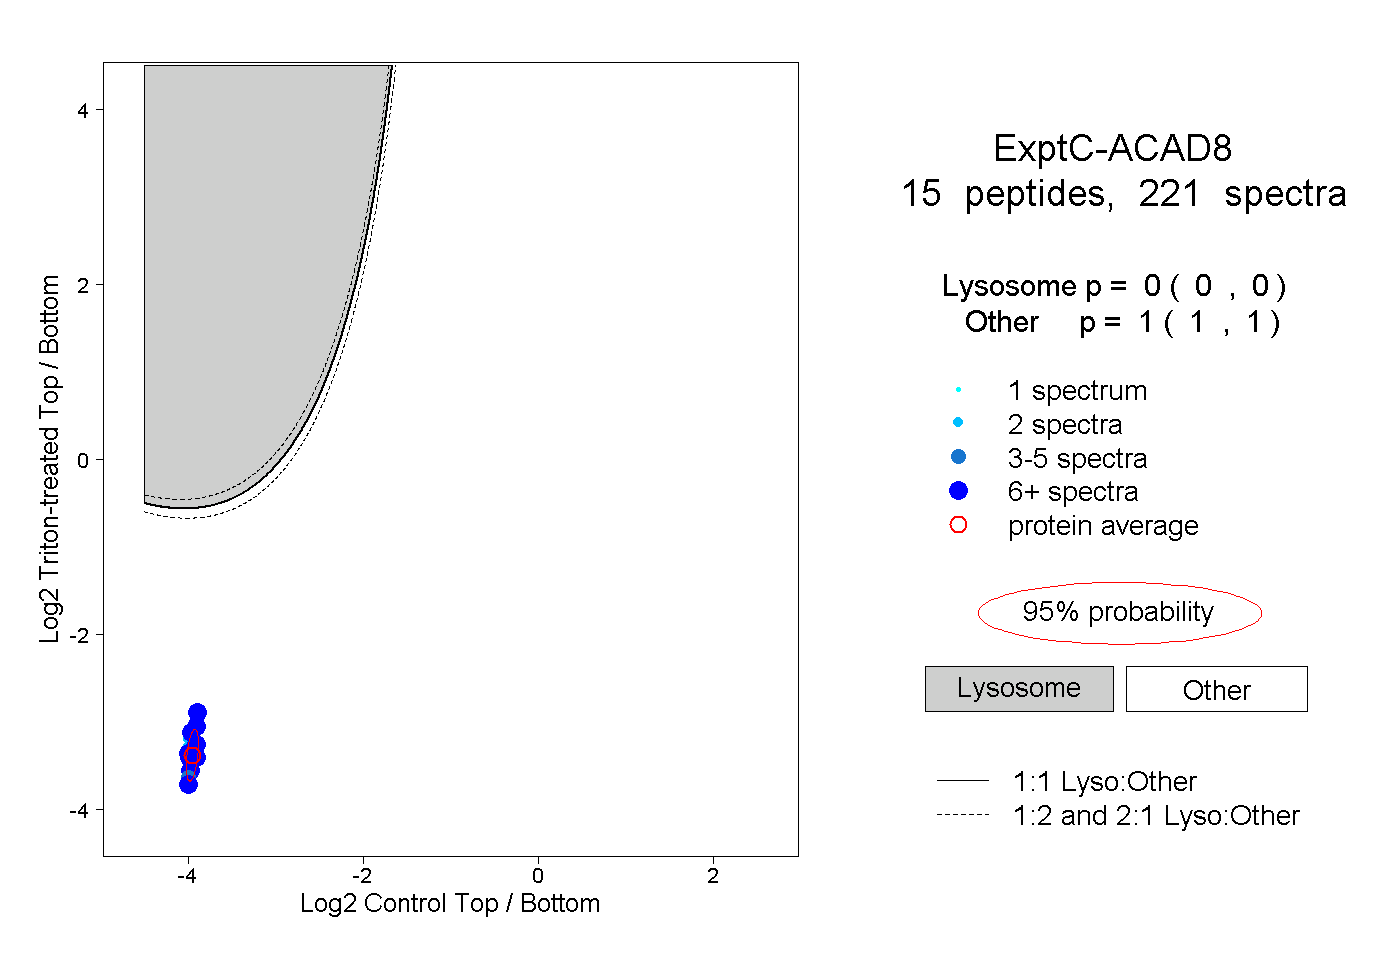 |
0.000 0.000 | 0.000 |
1.000 1.000 | 1.000 |
||||||||
| Plot | Lyso | Other | |||||||||||
| Expt D |
9 peptides |
39 spectra |
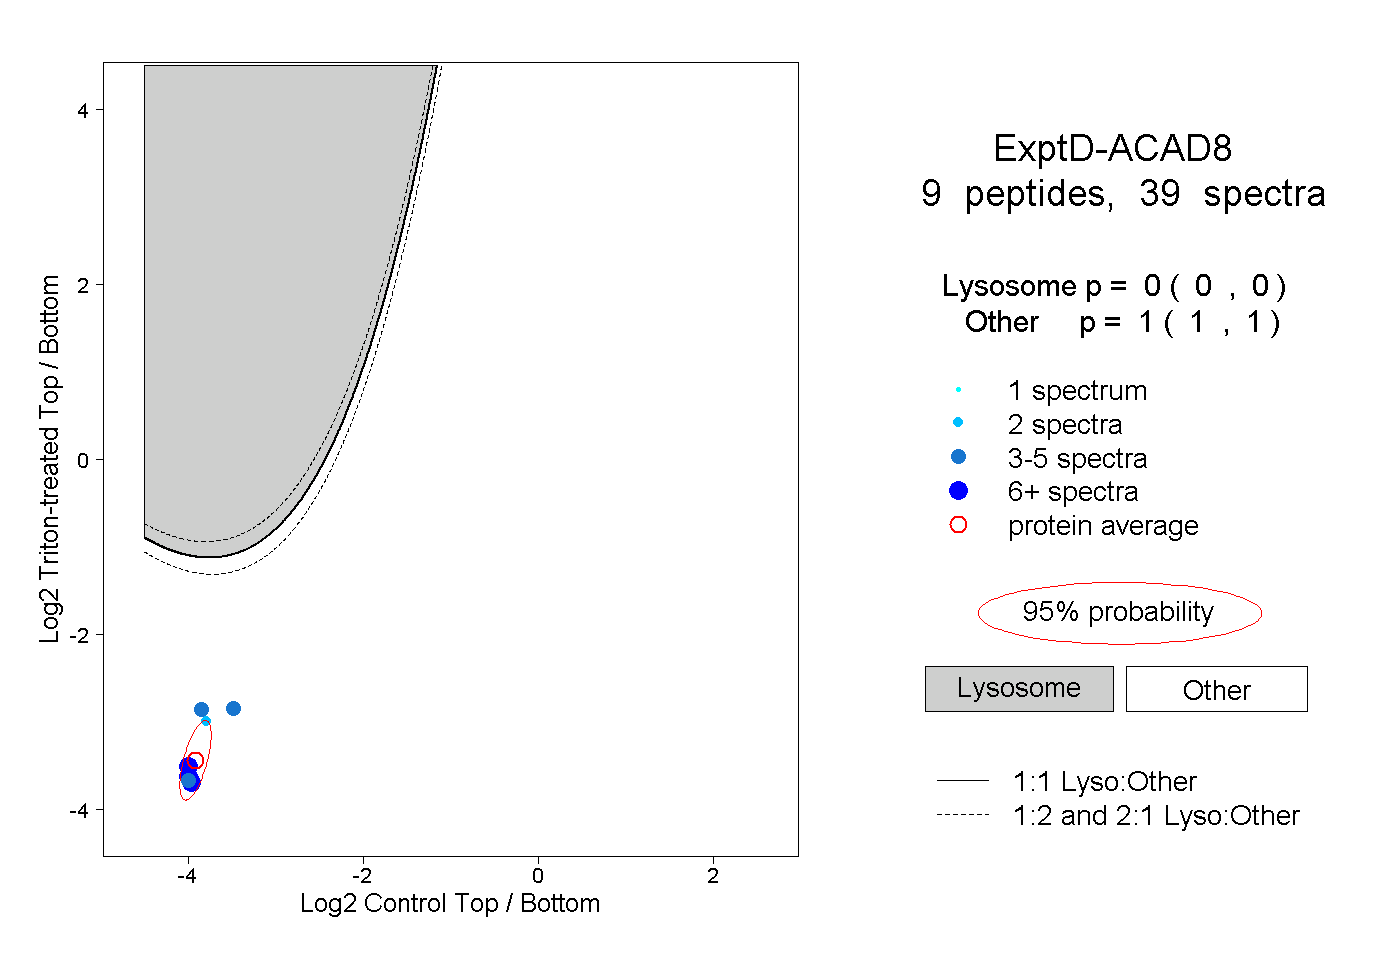 |
0.000 0.000 | 0.000 |
1.000 1.000 | 1.000 |