8
8peptides
spectra
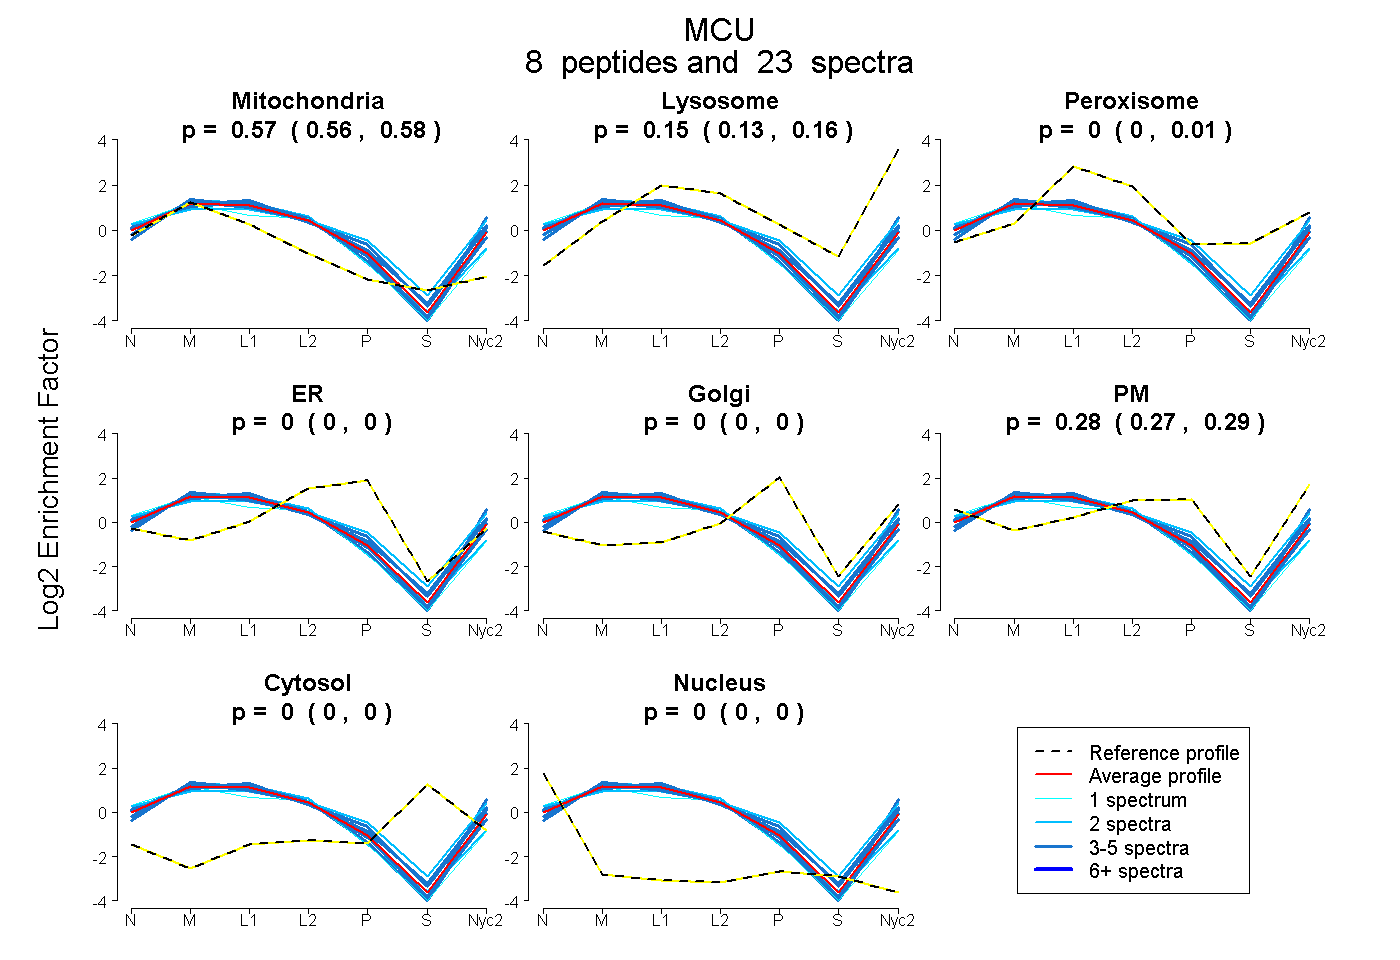
0.562 | 0.578
0.125 | 0.157
0.000 | 0.013
0.000 | 0.000
0.000 | 0.000
0.267 | 0.294
0.000 | 0.000
0.000 | 0.000
4peptides
spectra
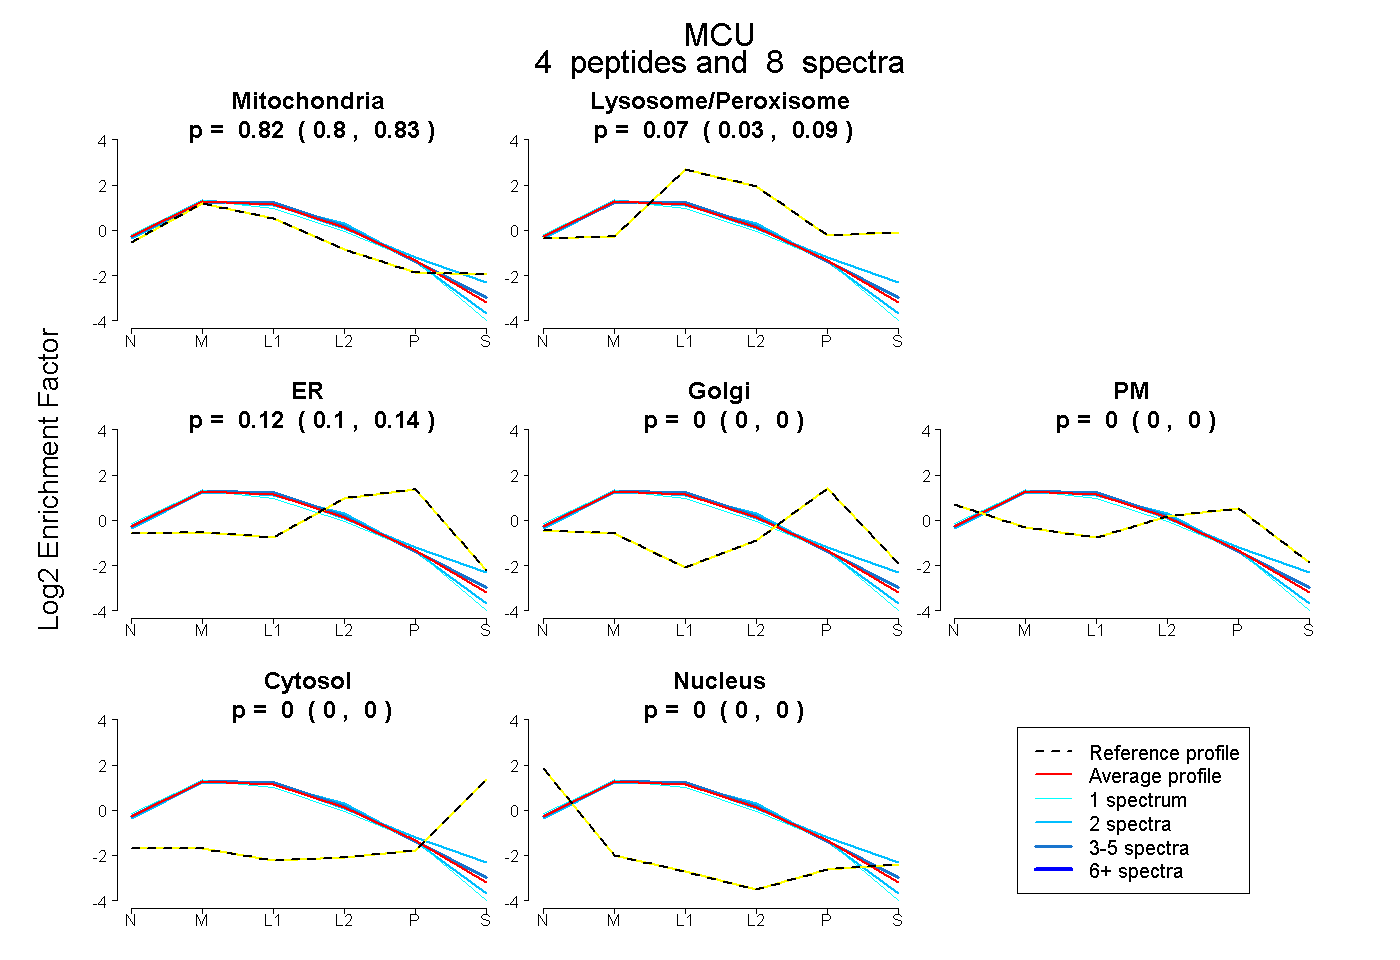
0.797 | 0.832
0.032 | 0.094
0.097 | 0.139
0.000 | 0.000
0.000 | 0.000
0.000 | 0.000
0.000 | 0.000
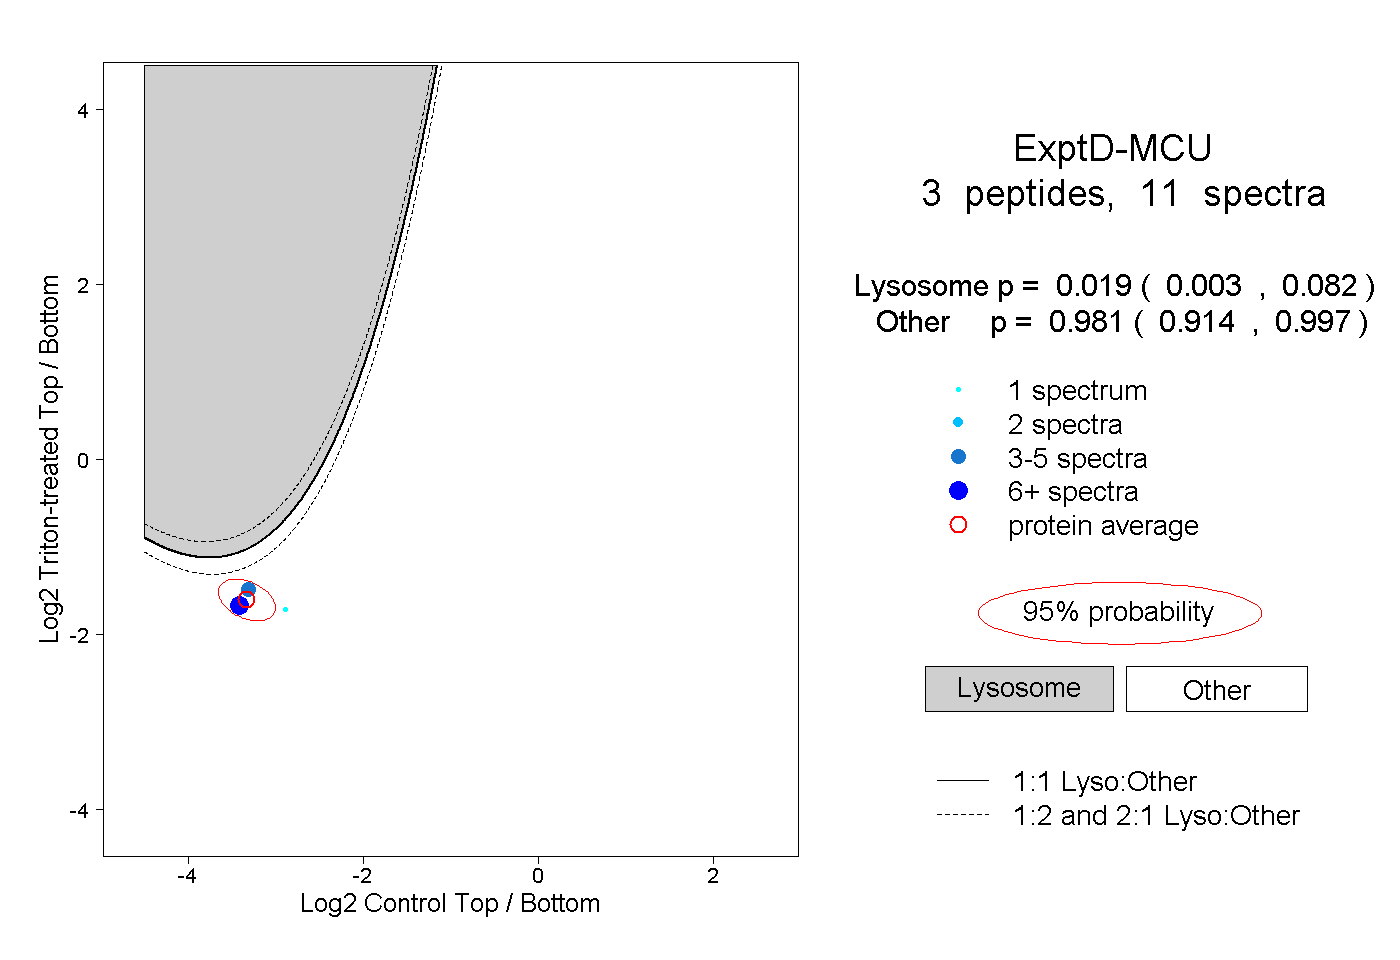
9peptides
spectra
0.000 | 0.000
1.000 | 1.000