 8
8peptides
spectra
0.000 | 0.000
0.000 | 0.000
0.000 | 0.000
0.000 | 0.054
0.130 | 0.227
0.000 | 0.000
0.555 | 0.591
0.195 | 0.240
1peptide
spectrum
NA | NA
NA | NA
NA | NA
NA | NA
NA | NA
NA | NA
NA | NA
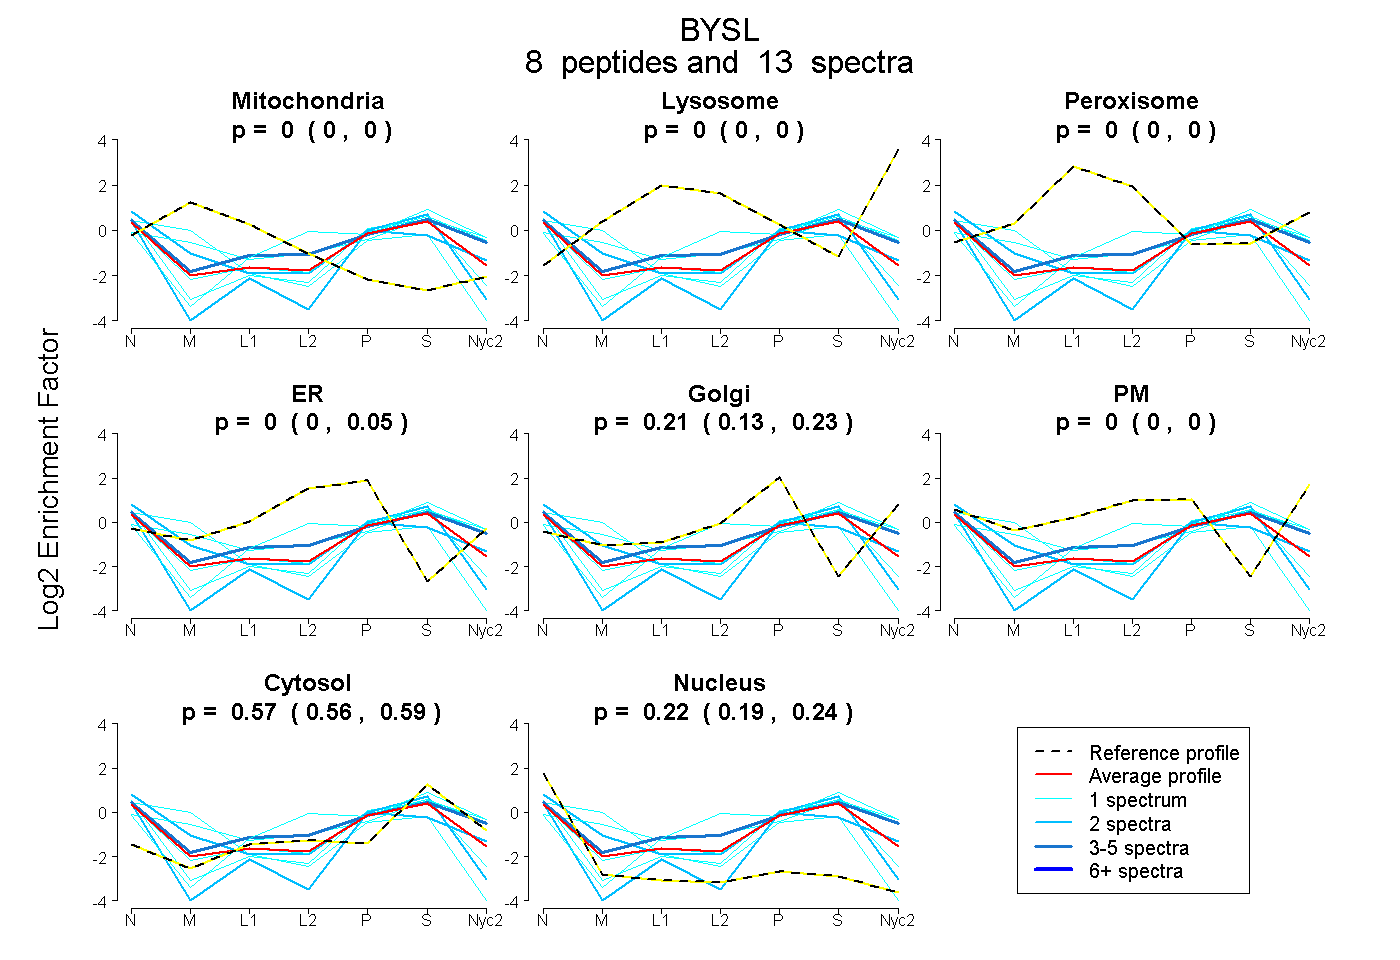
| Plot | Mito | Lyso | Perox | ER | Golgi | PM | Cytosol | Nucleus | |||||
| Expt A |
8 peptides |
13 spectra |
|
0.000 0.000 | 0.000 |
0.000 0.000 | 0.000 |
0.000 0.000 | 0.000 |
0.000 0.000 | 0.054 |
0.206 0.130 | 0.227 |
0.000 0.000 | 0.000 |
0.574 0.555 | 0.591 |
0.220 0.195 | 0.240 |
||
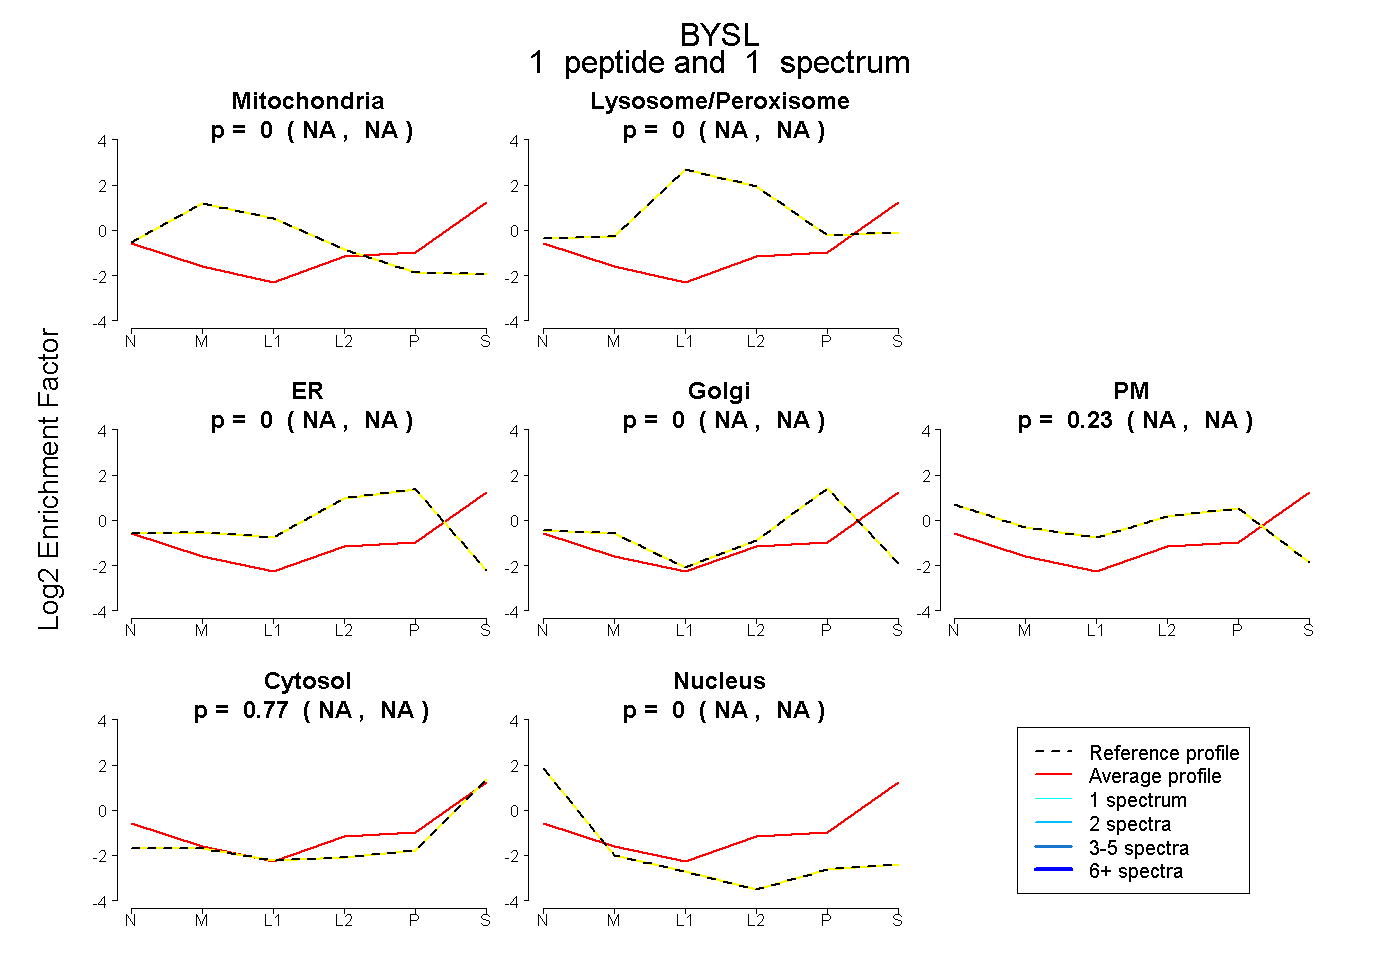
| Plot | Mito | Lyso or Perox | ER | Golgi | PM | Cytosol | Nucleus | ||||||
| Expt B |
1 peptide |
1 spectrum |
|
0.000 NA | NA |
0.000 NA | NA |
0.000 NA | NA |
0.000 NA | NA |
0.232 NA | NA |
0.768 NA | NA |
0.000 NA | NA |
| 1 spectrum, TLADIIMEK | 0.000 | 0.000 | 0.000 | 0.000 | 0.232 | 0.768 | 0.000 |
| Plot | Lyso | Other | |||||||||||
| Expt C |
3 peptides |
5 spectra |
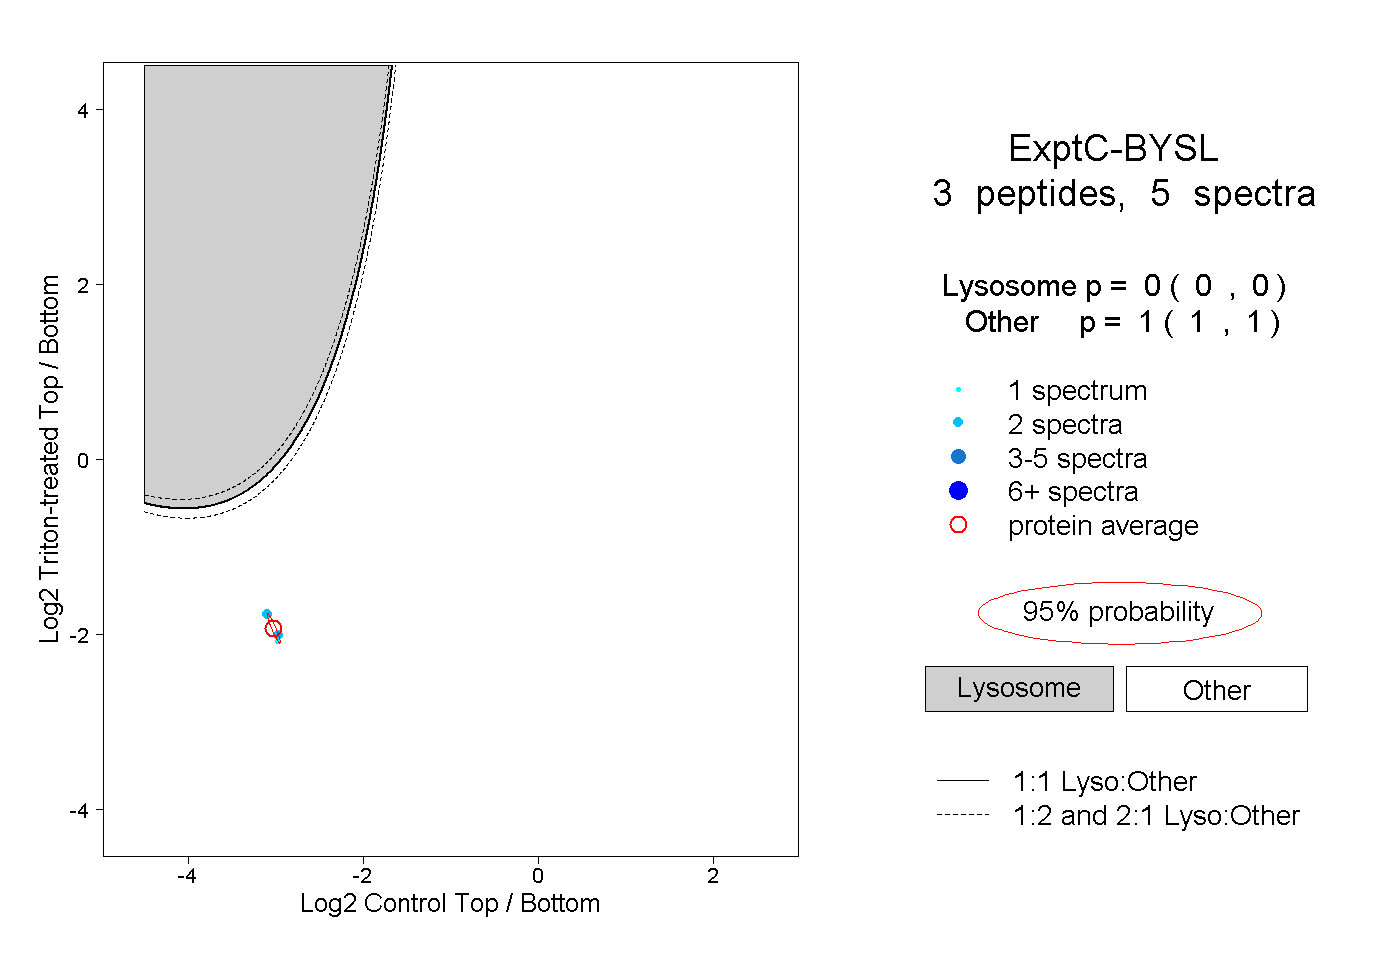 |
0.000 0.000 | 0.000 |
1.000 1.000 | 1.000 |