 3
3peptides
spectra
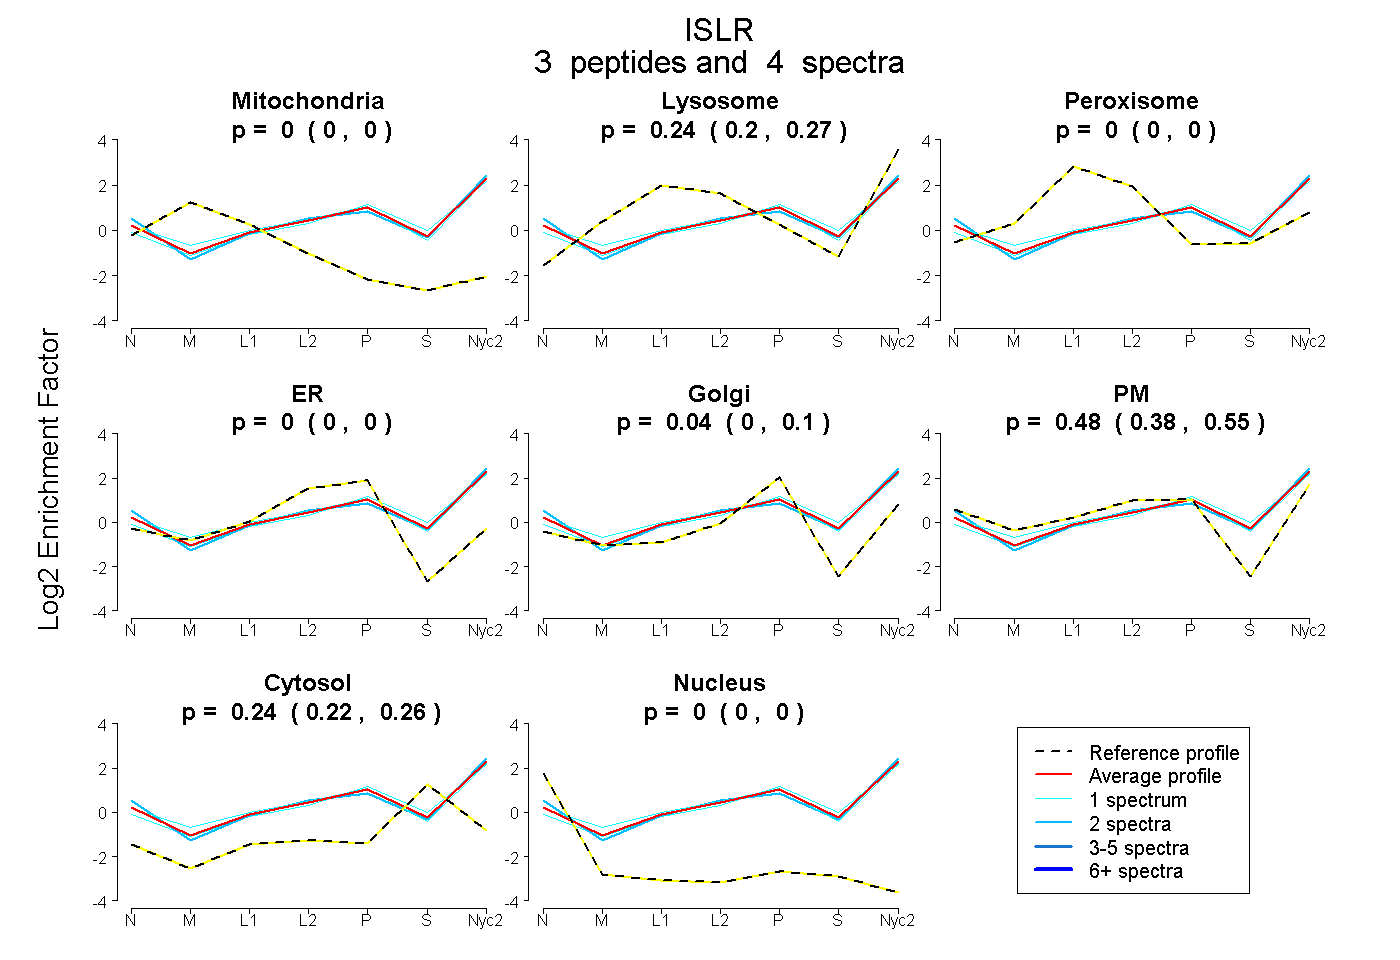
0.000 | 0.000
0.199 | 0.275
0.000 | 0.000
0.000 | 0.000
0.000 | 0.095
0.384 | 0.549
0.221 | 0.256
0.000 | 0.000
1peptide
spectrum
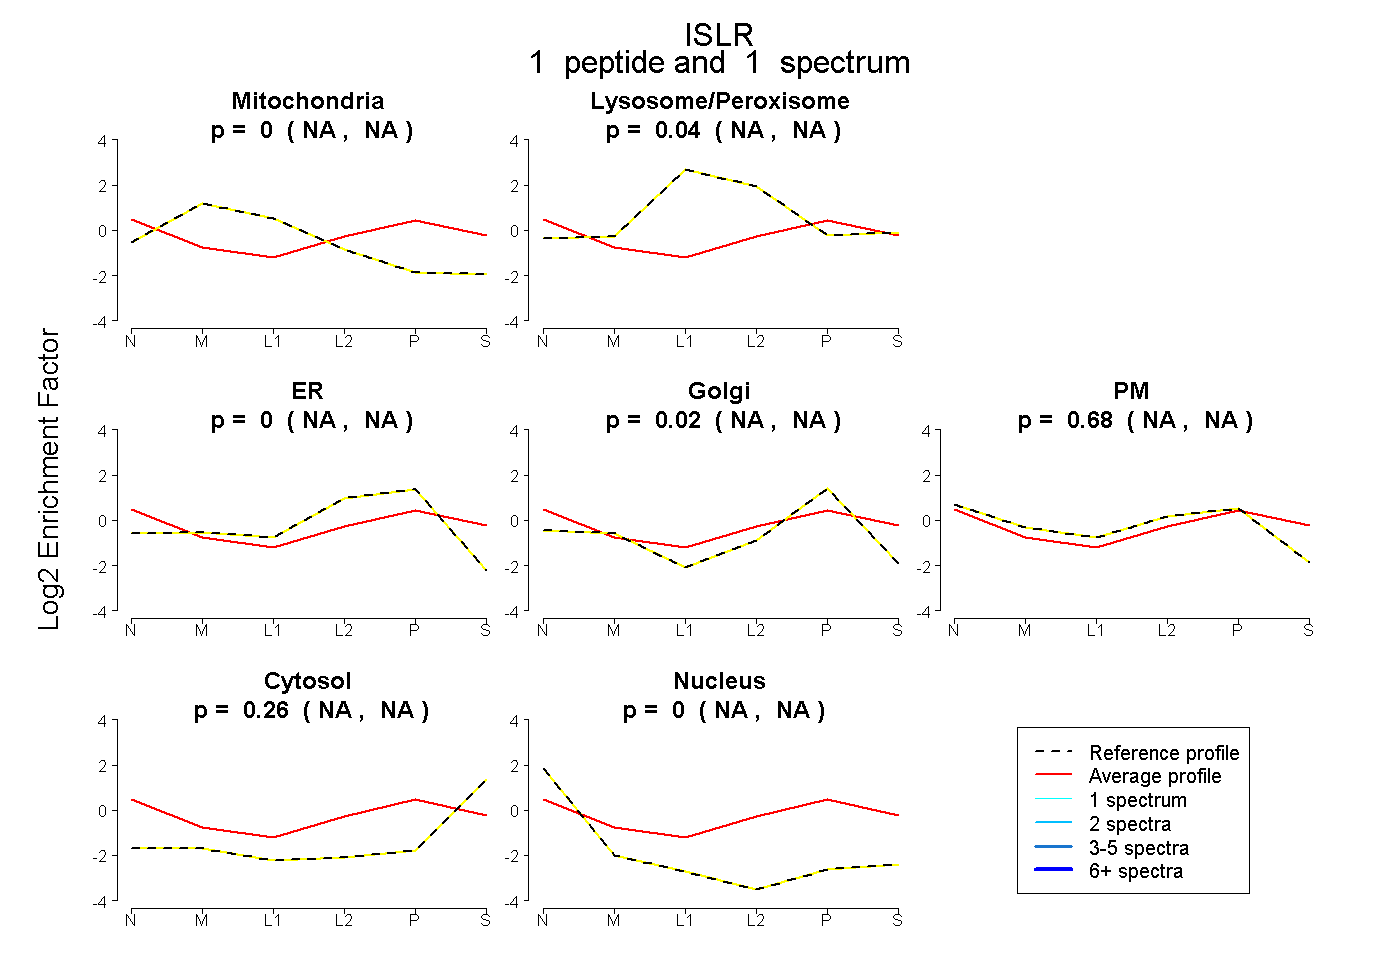
NA | NA
NA | NA
NA | NA
NA | NA
NA | NA
NA | NA
NA | NA
4peptides
spectra
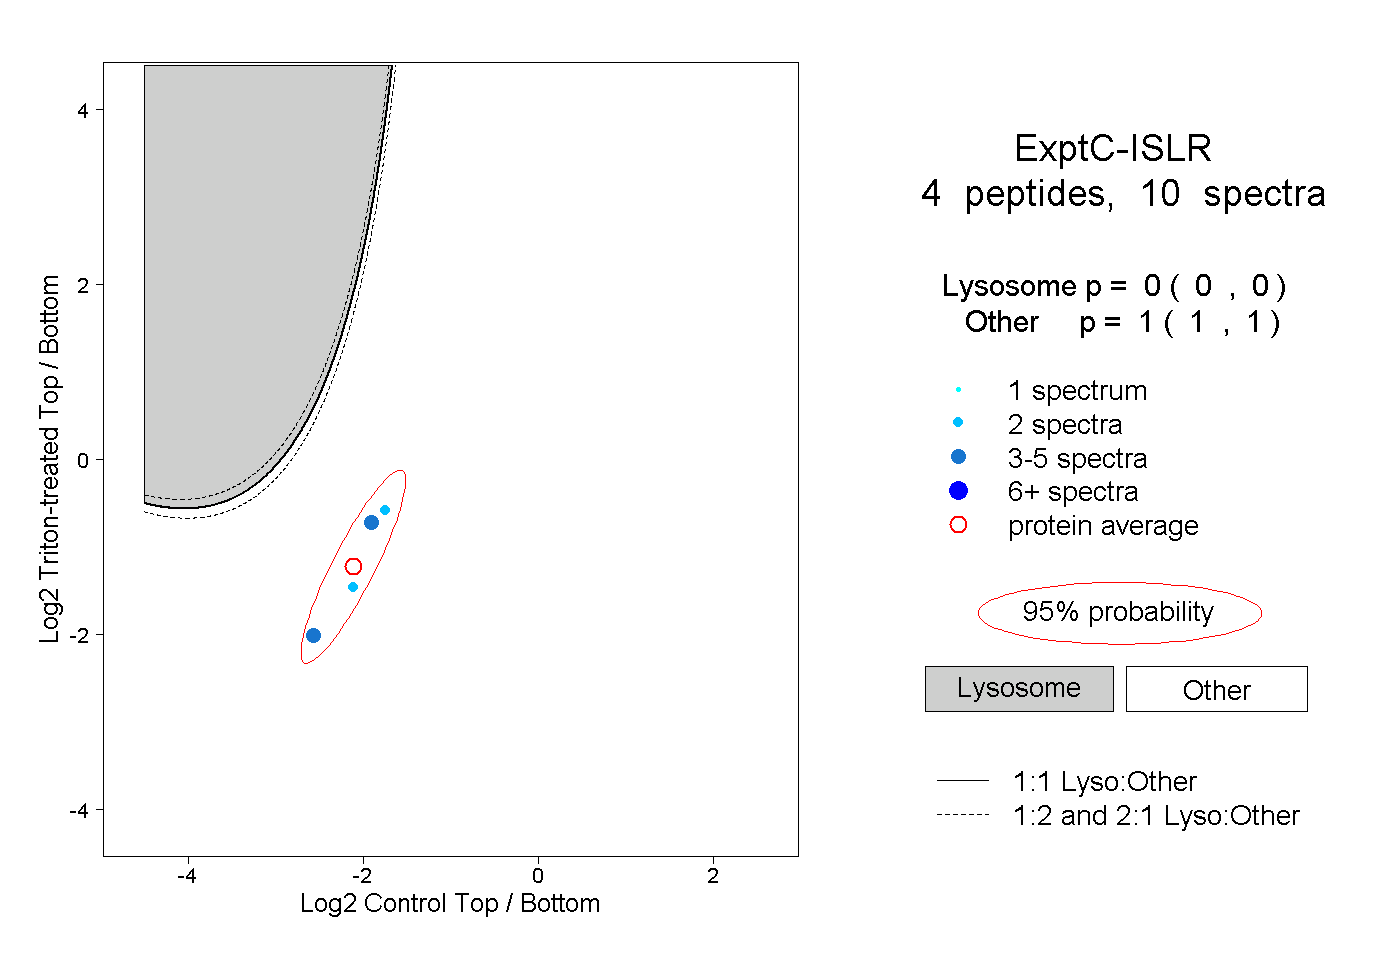
0.000 | 0.000
1.000 | 1.000