 3
3peptides
spectra
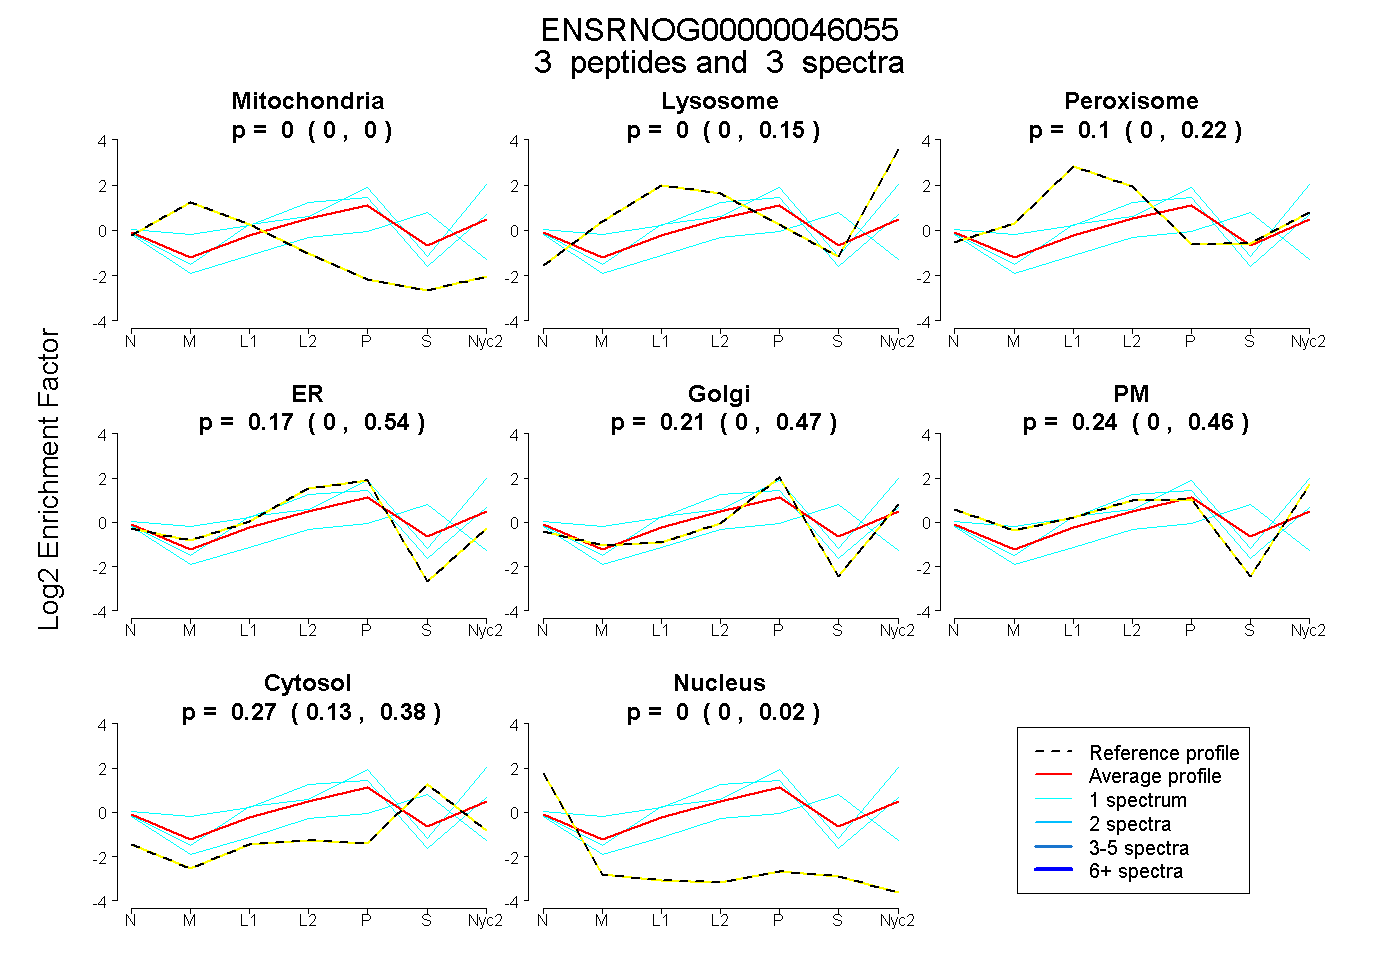
0.000 | 0.000
0.000 | 0.153
0.000 | 0.215
0.000 | 0.544
0.000 | 0.472
0.000 | 0.460
0.132 | 0.381
0.000 | 0.015
| Plot | Mito | Lyso | Perox | ER | Golgi | PM | Cytosol | Nucleus | |||||
| Expt A |
3 peptides |
3 spectra |
|
0.000 0.000 | 0.000 |
0.000 0.000 | 0.153 |
0.103 0.000 | 0.215 |
0.173 0.000 | 0.544 |
0.212 0.000 | 0.472 |
0.242 0.000 | 0.460 |
0.269 0.132 | 0.381 |
0.000 0.000 | 0.015 |
| 1 spectrum, NENSLAATLK | 0.000 | 0.000 | 0.196 | 0.305 | 0.204 | 0.281 | 0.014 | 0.000 | ||
| 1 spectrum, ASLIDMLQLSS | 0.000 | 0.000 | 0.000 | 0.280 | 0.000 | 0.000 | 0.693 | 0.027 | ||
| 1 spectrum, AALNALQPPEFR | 0.000 | 0.269 | 0.000 | 0.000 | 0.525 | 0.147 | 0.058 | 0.000 |