 5
5peptides
spectra
0.000 | 0.000
0.000 | 0.000
0.000 | 0.000
0.733 | 0.812
0.167 | 0.254
0.000 | 0.000
0.000 | 0.007
0.000 | 0.017
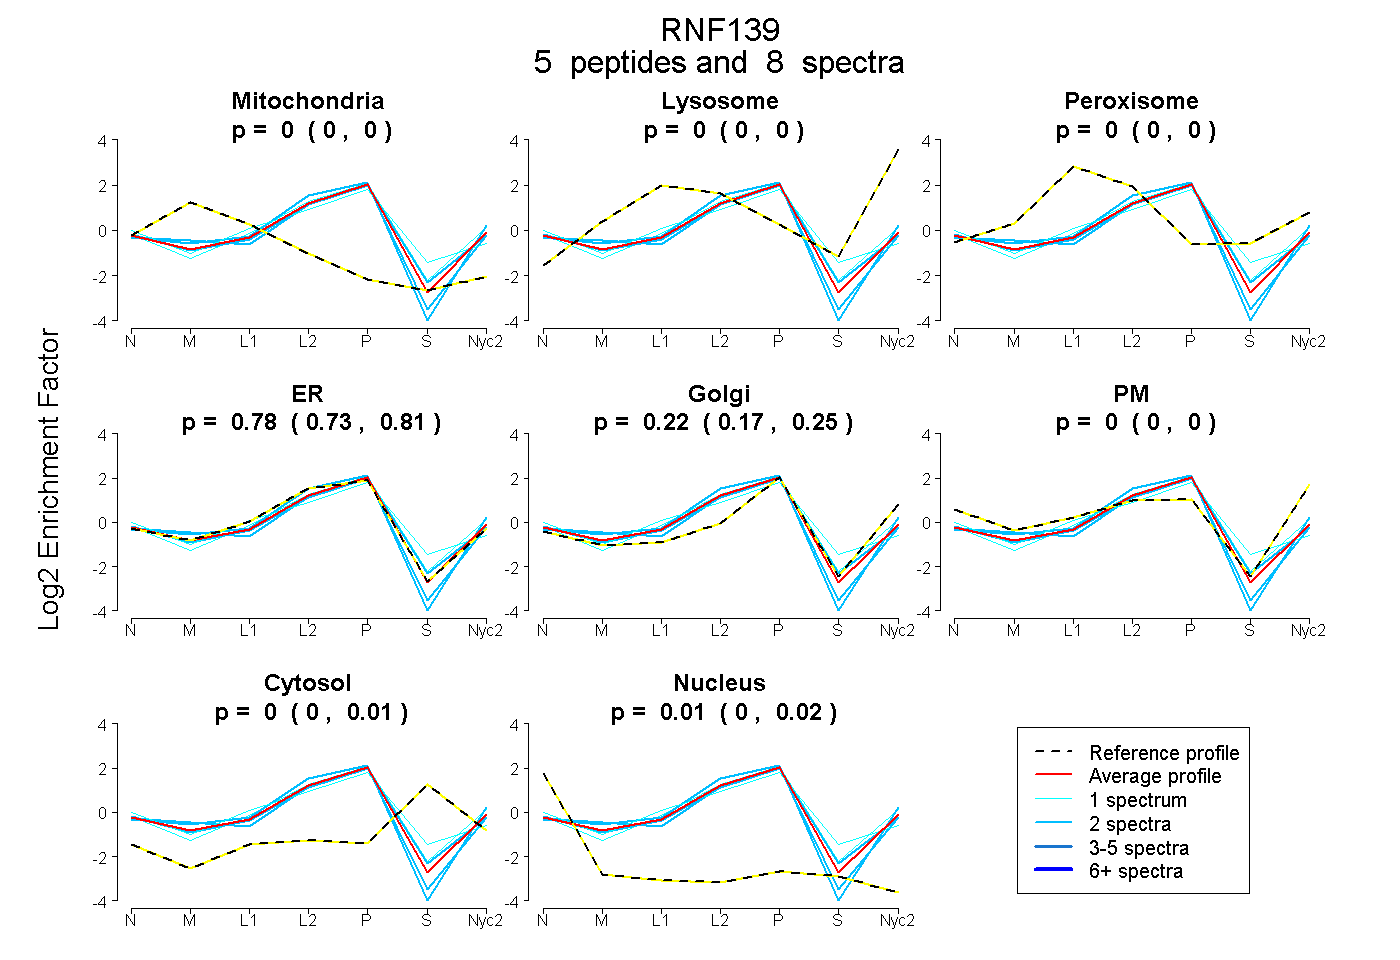
| Plot | Mito | Lyso | Perox | ER | Golgi | PM | Cytosol | Nucleus | |||||
| Expt A |
5 peptides |
8 spectra |
|
0.000 0.000 | 0.000 |
0.000 0.000 | 0.000 |
0.000 0.000 | 0.000 |
0.776 0.733 | 0.812 |
0.216 0.167 | 0.254 |
0.000 0.000 | 0.000 |
0.000 0.000 | 0.007 |
0.008 0.000 | 0.017 |
| 1 spectrum, VYIEDDIK | 0.000 | 0.000 | 0.025 | 0.808 | 0.000 | 0.000 | 0.167 | 0.000 | ||
| 2 spectra, VFWLTR | 0.000 | 0.000 | 0.000 | 0.860 | 0.071 | 0.069 | 0.000 | 0.000 | ||
| 2 spectra, LDDYVYFVR | 0.000 | 0.000 | 0.000 | 0.755 | 0.202 | 0.000 | 0.032 | 0.010 | ||
| 2 spectra, ITPCNHYFHALCLR | 0.010 | 0.000 | 0.000 | 0.771 | 0.202 | 0.000 | 0.000 | 0.016 | ||
| 1 spectrum, FPDILR | 0.000 | 0.005 | 0.000 | 0.730 | 0.230 | 0.008 | 0.027 | 0.000 |
| Plot | Mito | Lyso or Perox | ER | Golgi | PM | Cytosol | Nucleus | ||||||
| Expt B |
1 peptide |
1 spectrum |
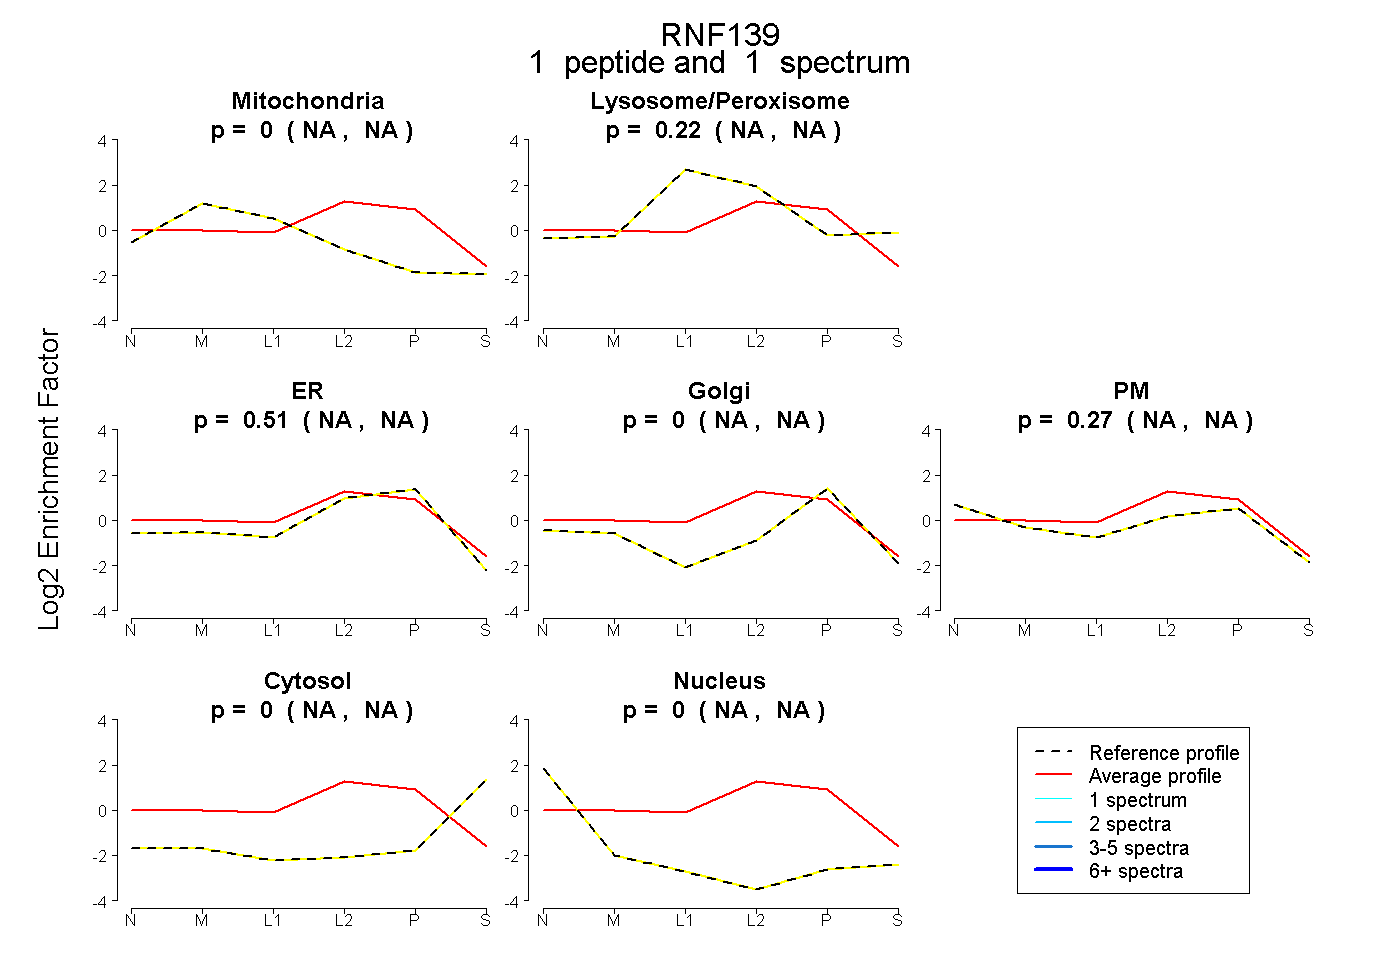 |
0.000 NA | NA |
0.222 NA | NA |
0.510 NA | NA |
0.000 NA | NA |
0.268 NA | NA |
0.000 NA | NA |
0.000 NA | NA |
|||
| Plot | Lyso | Other | |||||||||||
| Expt C |
3 peptides |
5 spectra |
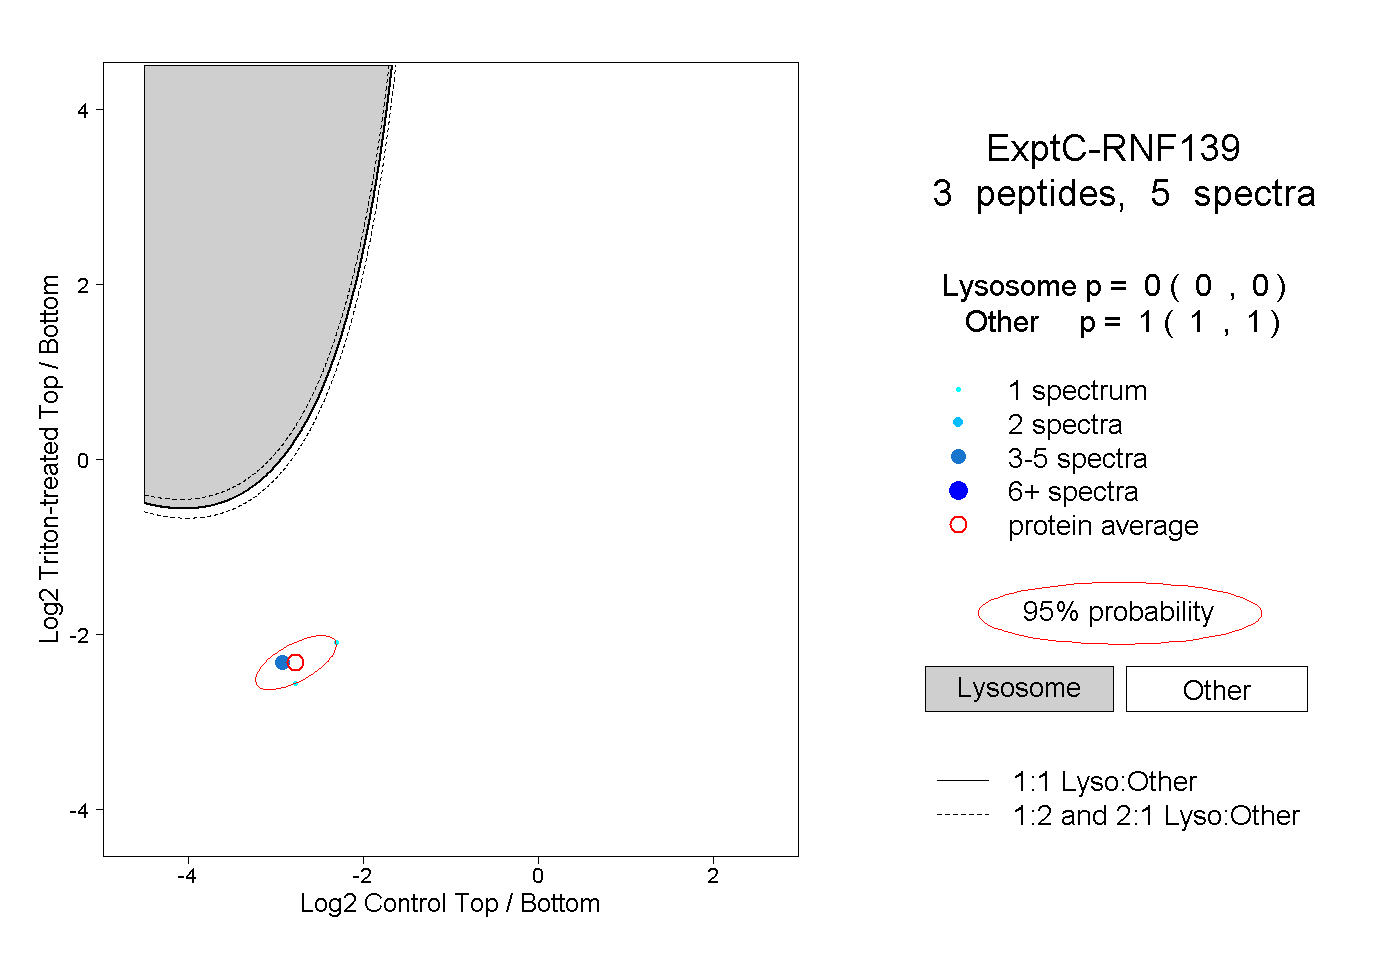 |
0.000 0.000 | 0.000 |
1.000 1.000 | 1.000 |
||||||||
| Plot | Lyso | Other | |||||||||||
| Expt D |
1 peptide |
1 spectrum |
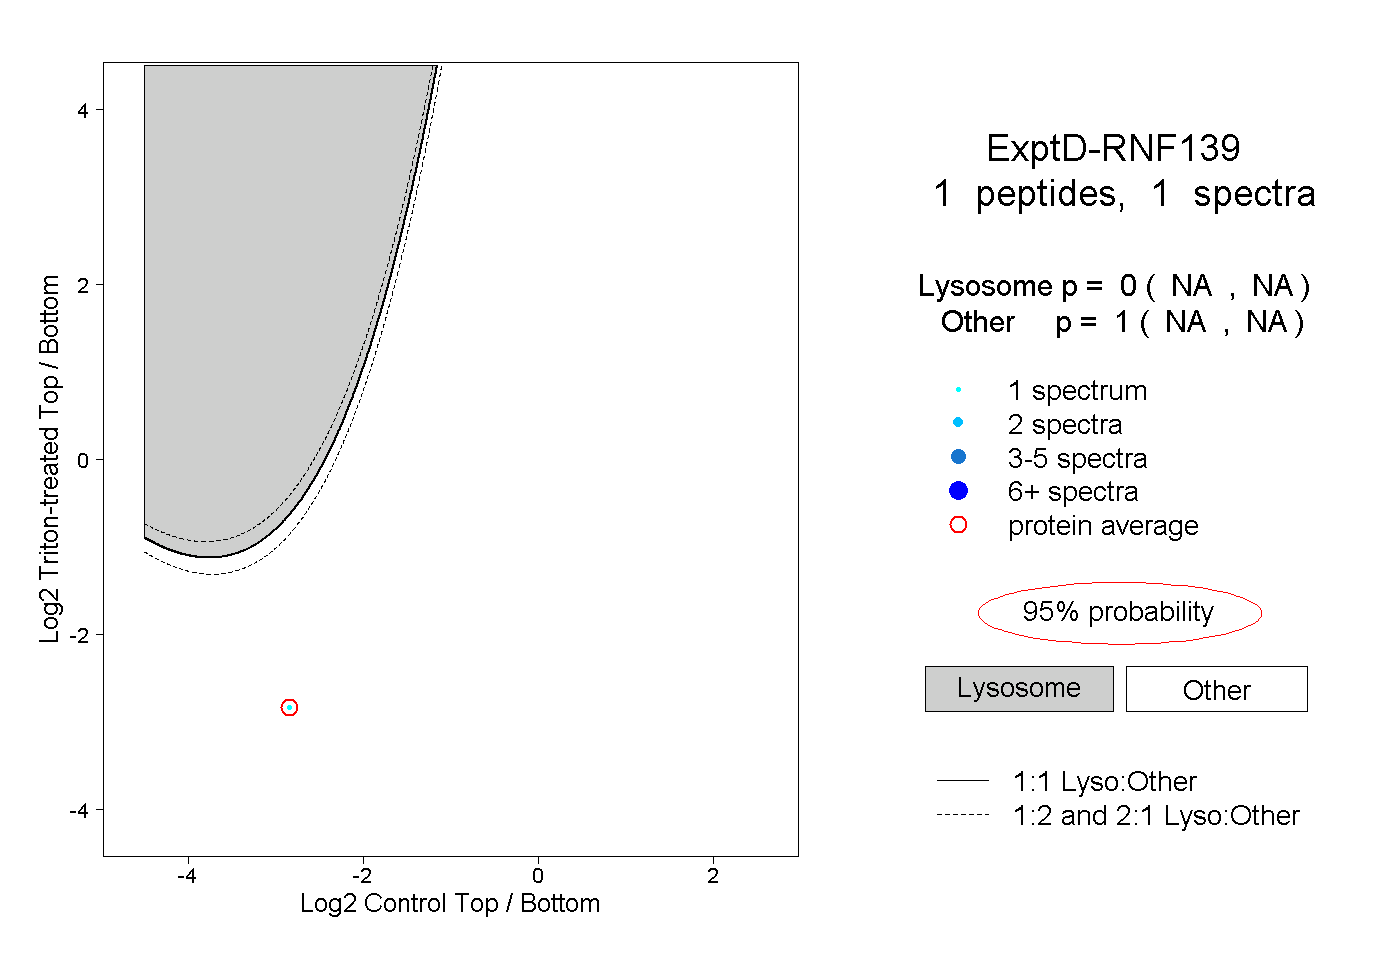 |
0.000 NA | NA |
1.000 NA | NA |