 7
7peptides
spectra
0.762 | 0.821
0.000 | 0.032
0.002 | 0.088
0.000 | 0.000
0.000 | 0.000
0.096 | 0.180
0.000 | 0.017
0.000 | 0.013
11peptides
spectra
0.000 | 0.001
0.999 | 1.000
| Plot | Mito | Lyso | Perox | ER | Golgi | PM | Cytosol | Nucleus | |||||
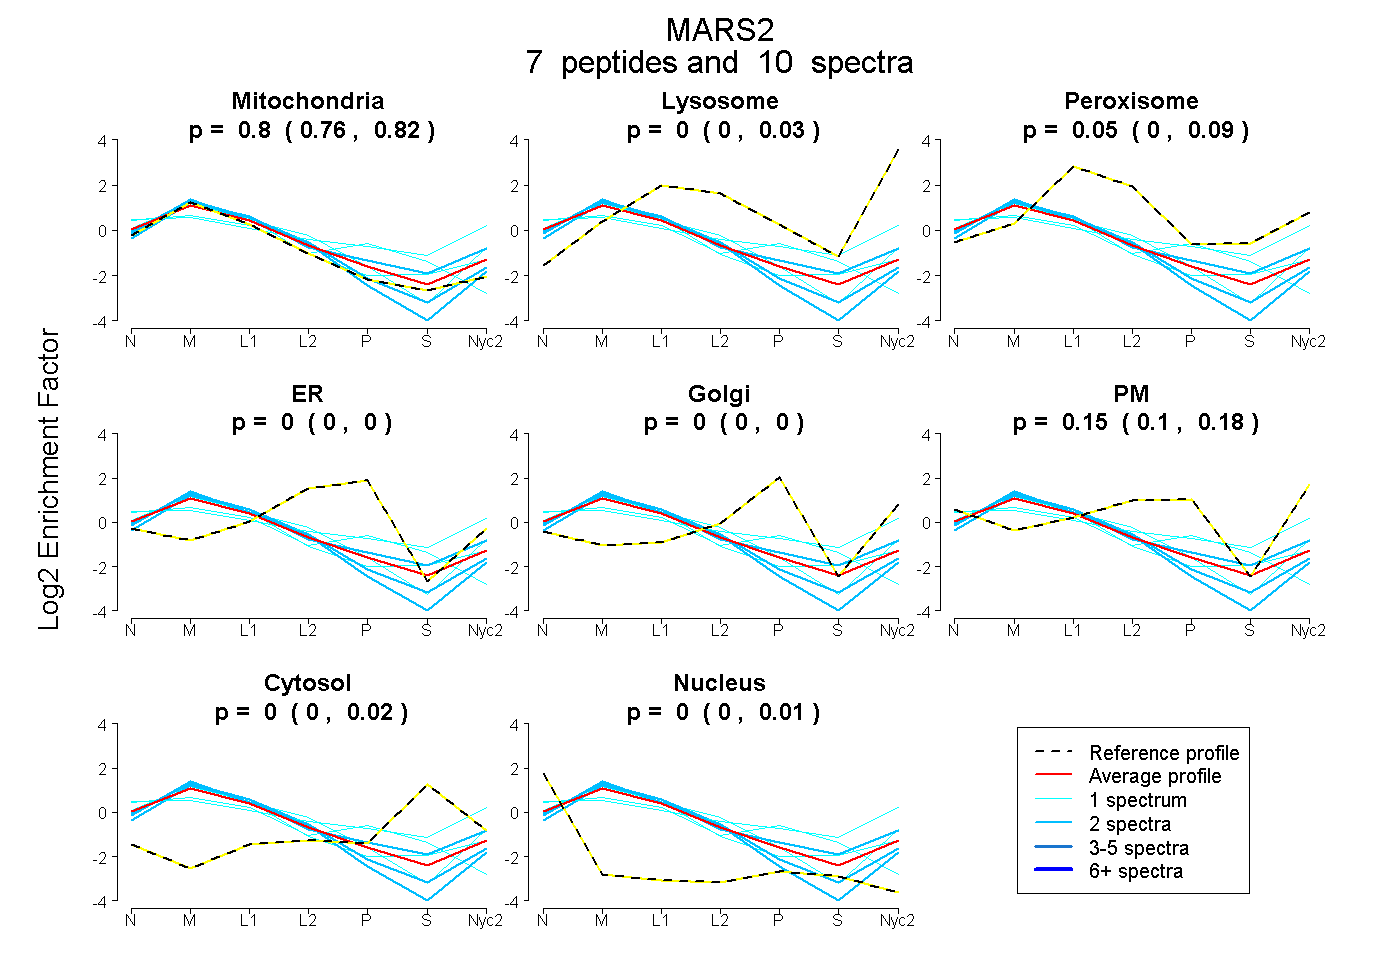
| Expt A |
7 peptides |
10 spectra |
|
0.798 0.762 | 0.821 |
0.000 0.000 | 0.032 |
0.053 0.002 | 0.088 |
0.000 0.000 | 0.000 |
0.000 0.000 | 0.000 |
0.149 0.096 | 0.180 |
0.000 0.000 | 0.017 |
0.000 0.000 | 0.013 |
||
| Plot | Lyso | Other | |||||||||||
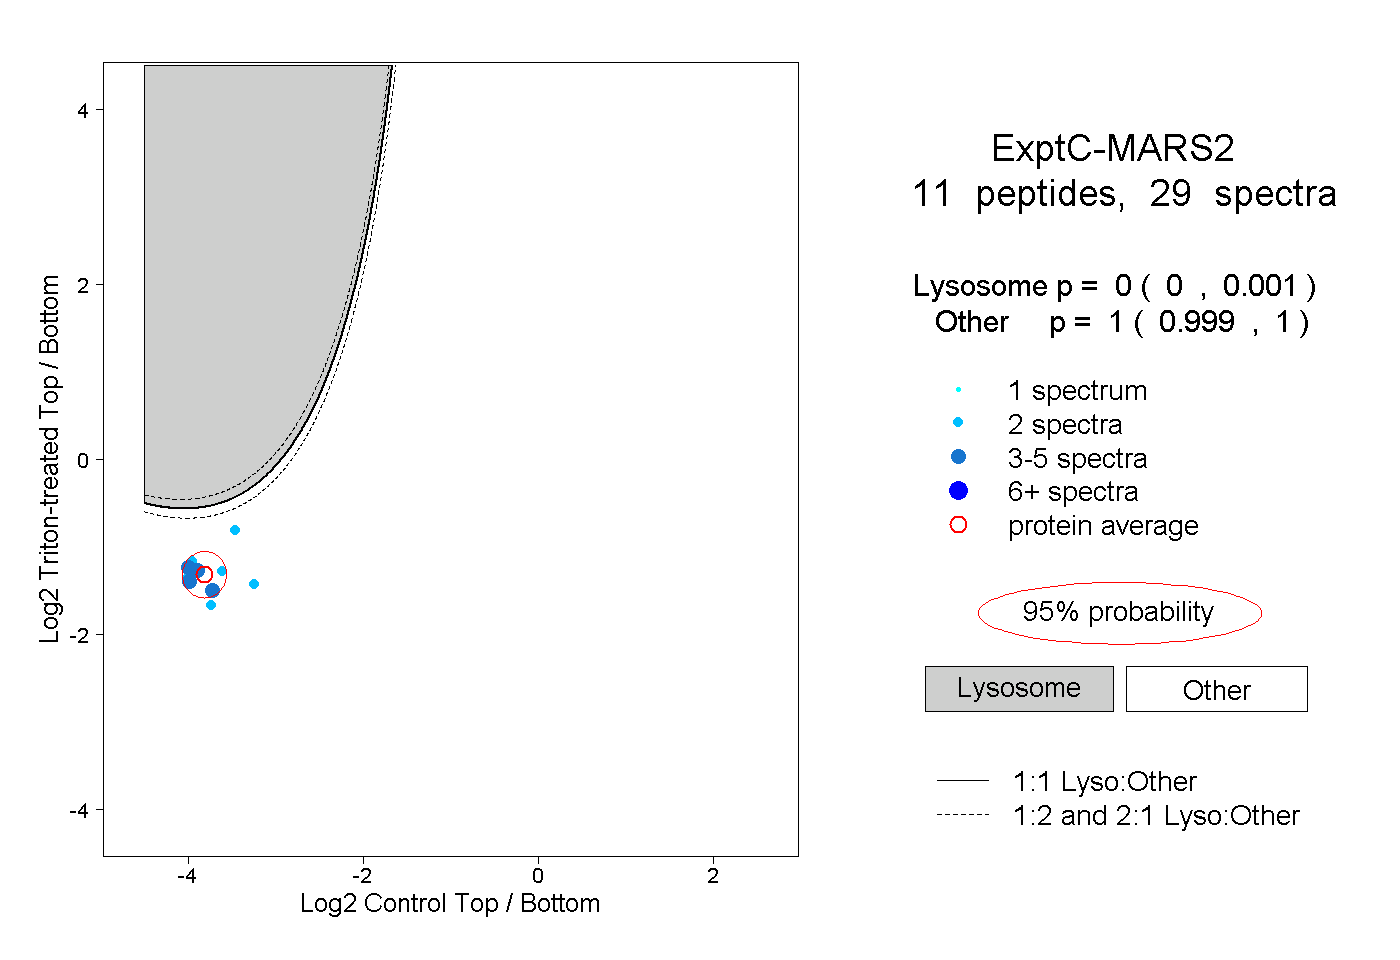
| Expt C |
11 peptides |
29 spectra |
|
0.000 0.000 | 0.001 |
1.000 0.999 | 1.000 |
| 2 spectra, LGPDTGLLFPR | 0.000 | 1.000 | ||||||||
| 2 spectra, EENYIFK | 0.000 | 1.000 | ||||||||
| 2 spectra, SLGELYFLPR | 0.000 | 1.000 | ||||||||
| 2 spectra, VPGSGSTR | 0.000 | 1.000 | ||||||||
| 4 spectra, VSAQFLQLFR | 0.000 | 1.000 | ||||||||
| 3 spectra, EAGISSTDFIR | 0.000 | 1.000 | ||||||||
| 5 spectra, YTVDGFR | 0.000 | 1.000 | ||||||||
| 3 spectra, SLGNVVDPR | 0.000 | 1.000 | ||||||||
| 2 spectra, ALEAVSSCVR | 0.000 | 1.000 | ||||||||
| 2 spectra, LGVSTTER | 0.000 | 1.000 | ||||||||
| 2 spectra, FYGHPCPFEGR | 0.015 | 0.985 |
| Plot | Lyso | Other | |||||||||||
| Expt D |
2 peptides |
4 spectra |
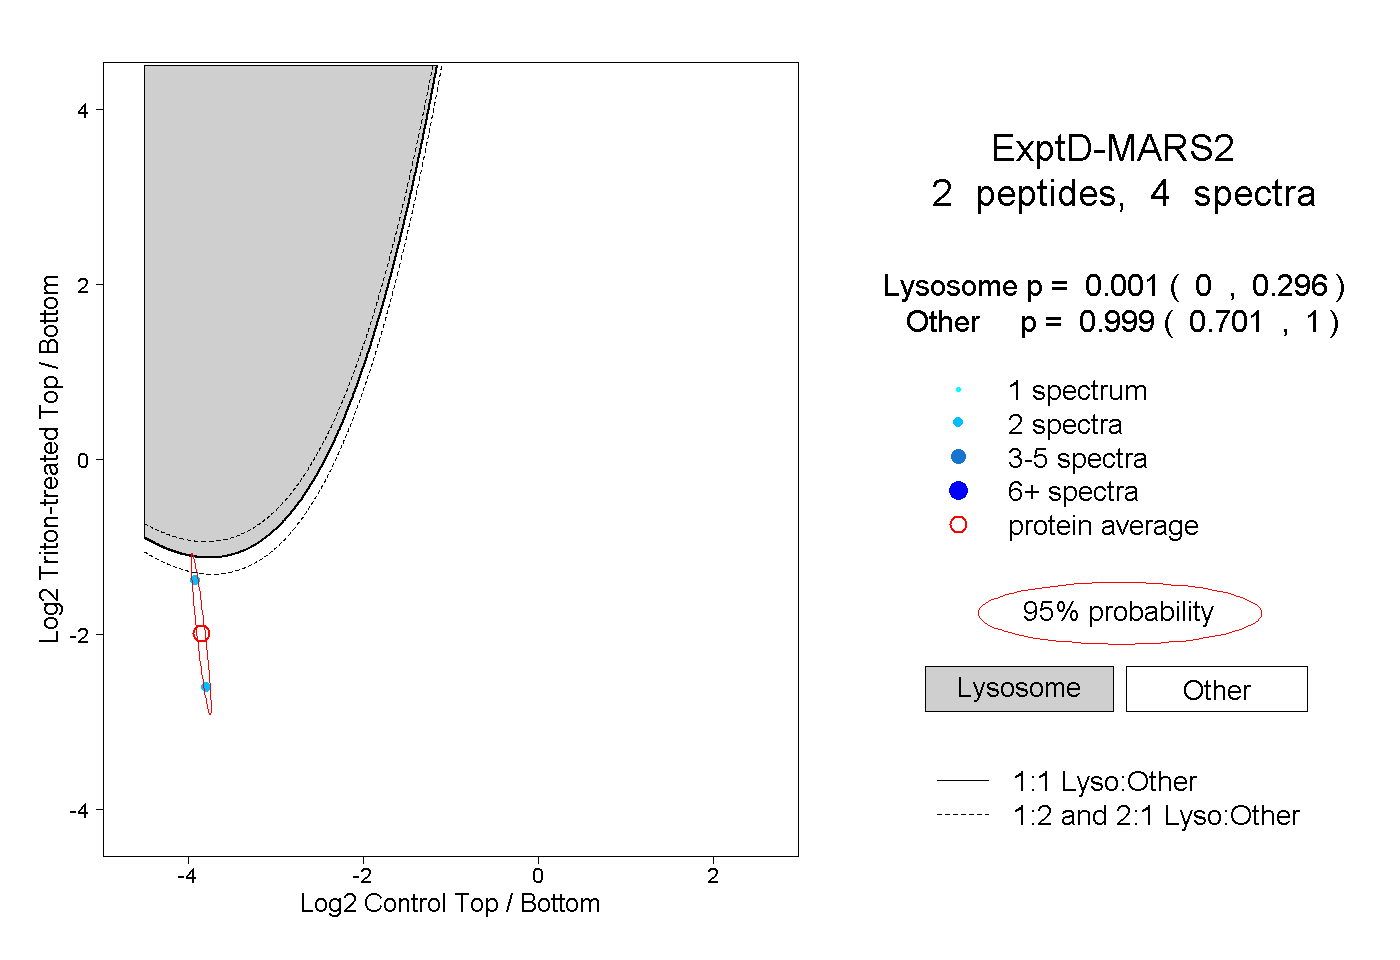 |
0.001 0.000 | 0.296 |
0.999 0.701 | 1.000 |