 7
7peptides
spectra
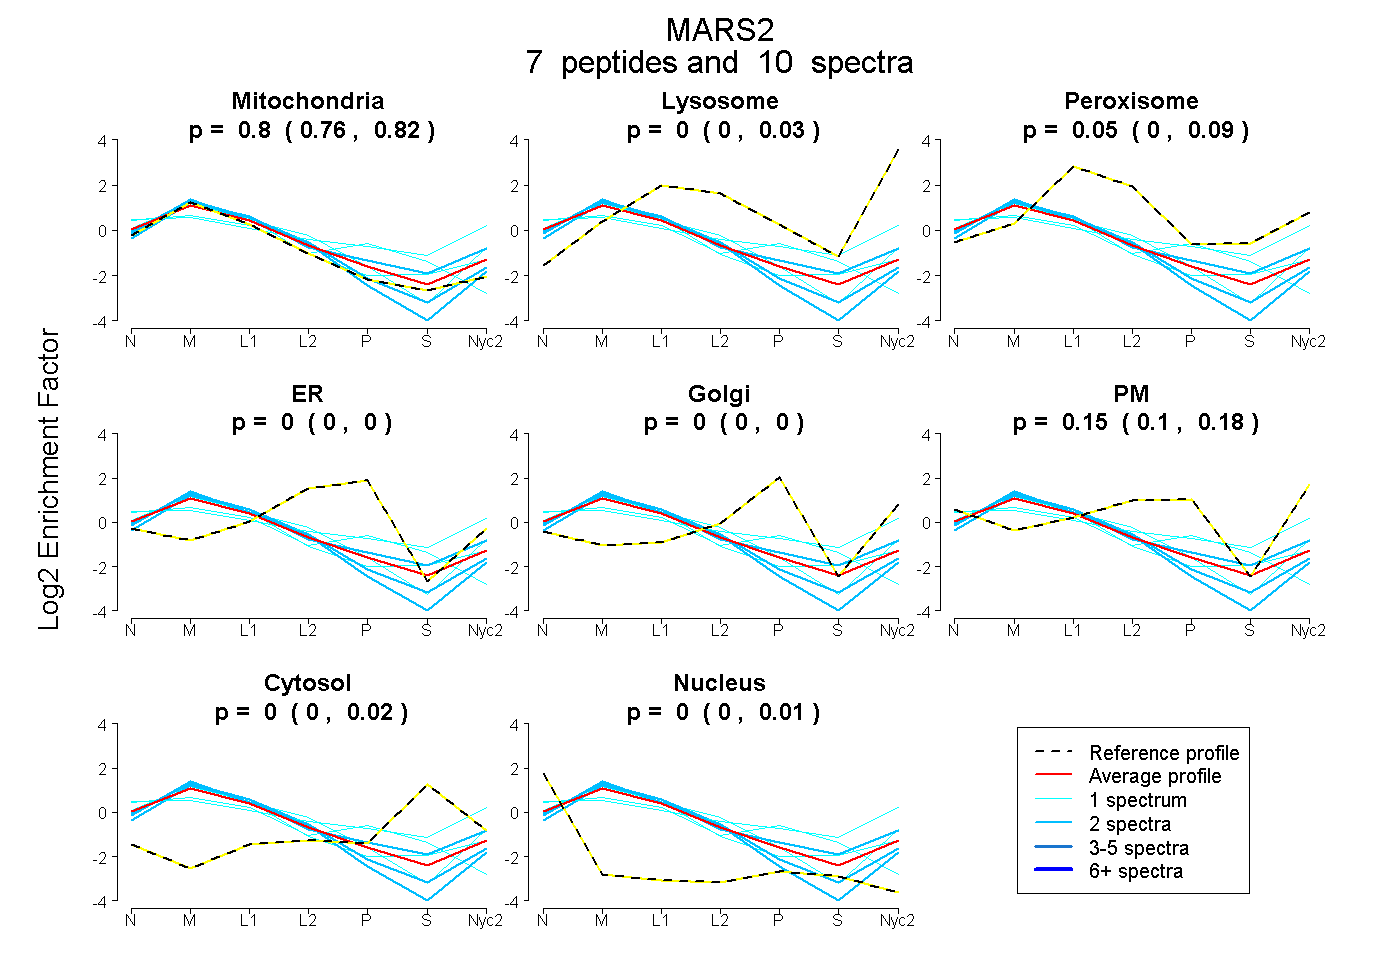
0.762 | 0.821
0.000 | 0.032
0.002 | 0.088
0.000 | 0.000
0.000 | 0.000
0.096 | 0.180
0.000 | 0.017
0.000 | 0.013
11peptides
spectra
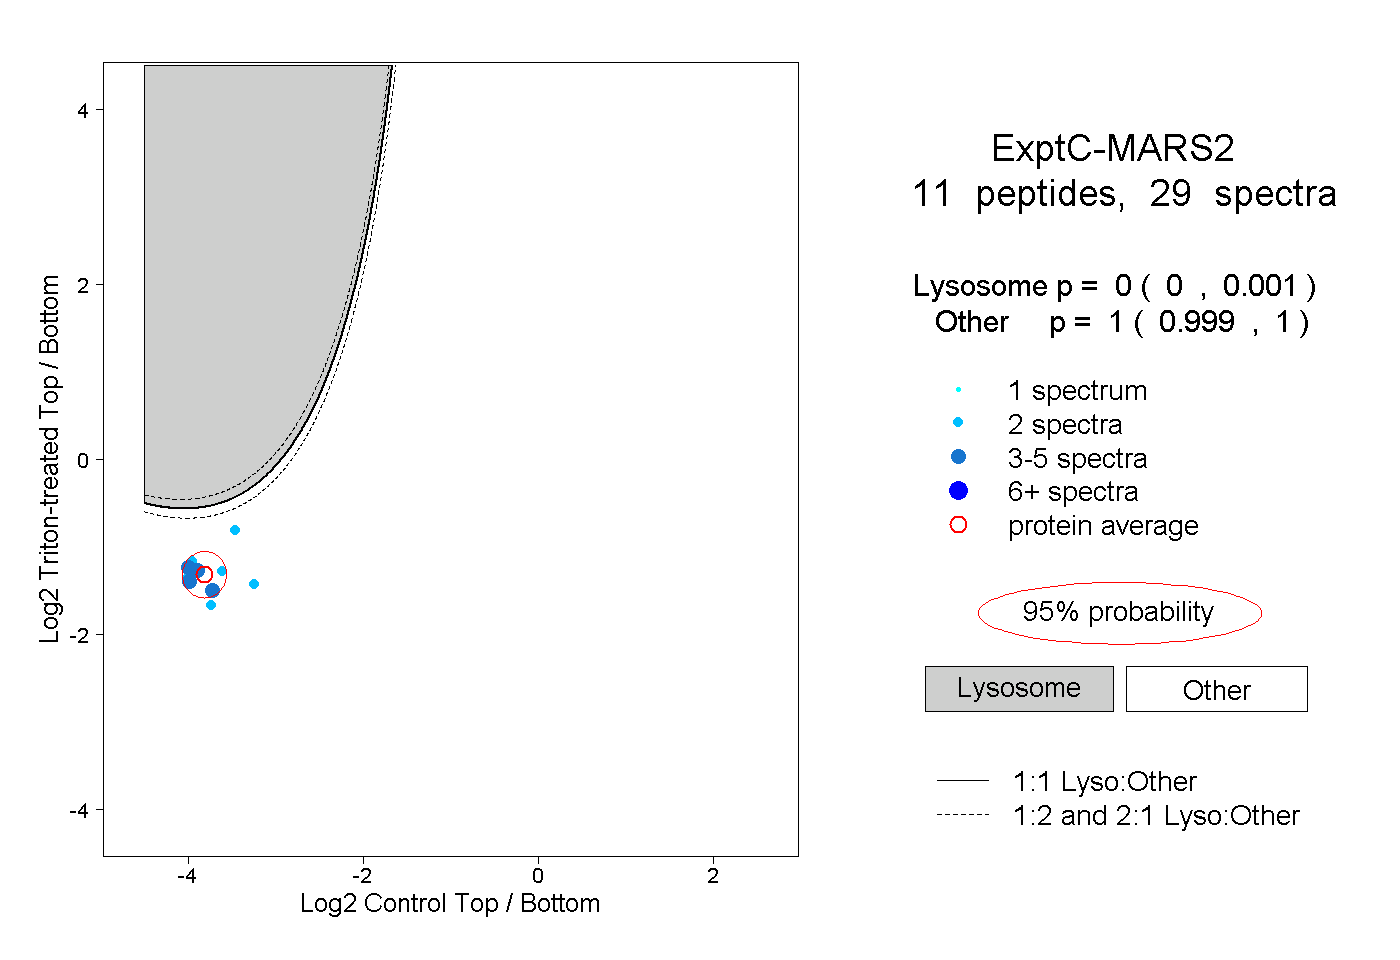
0.000 | 0.001
0.999 | 1.000
2peptides
spectra
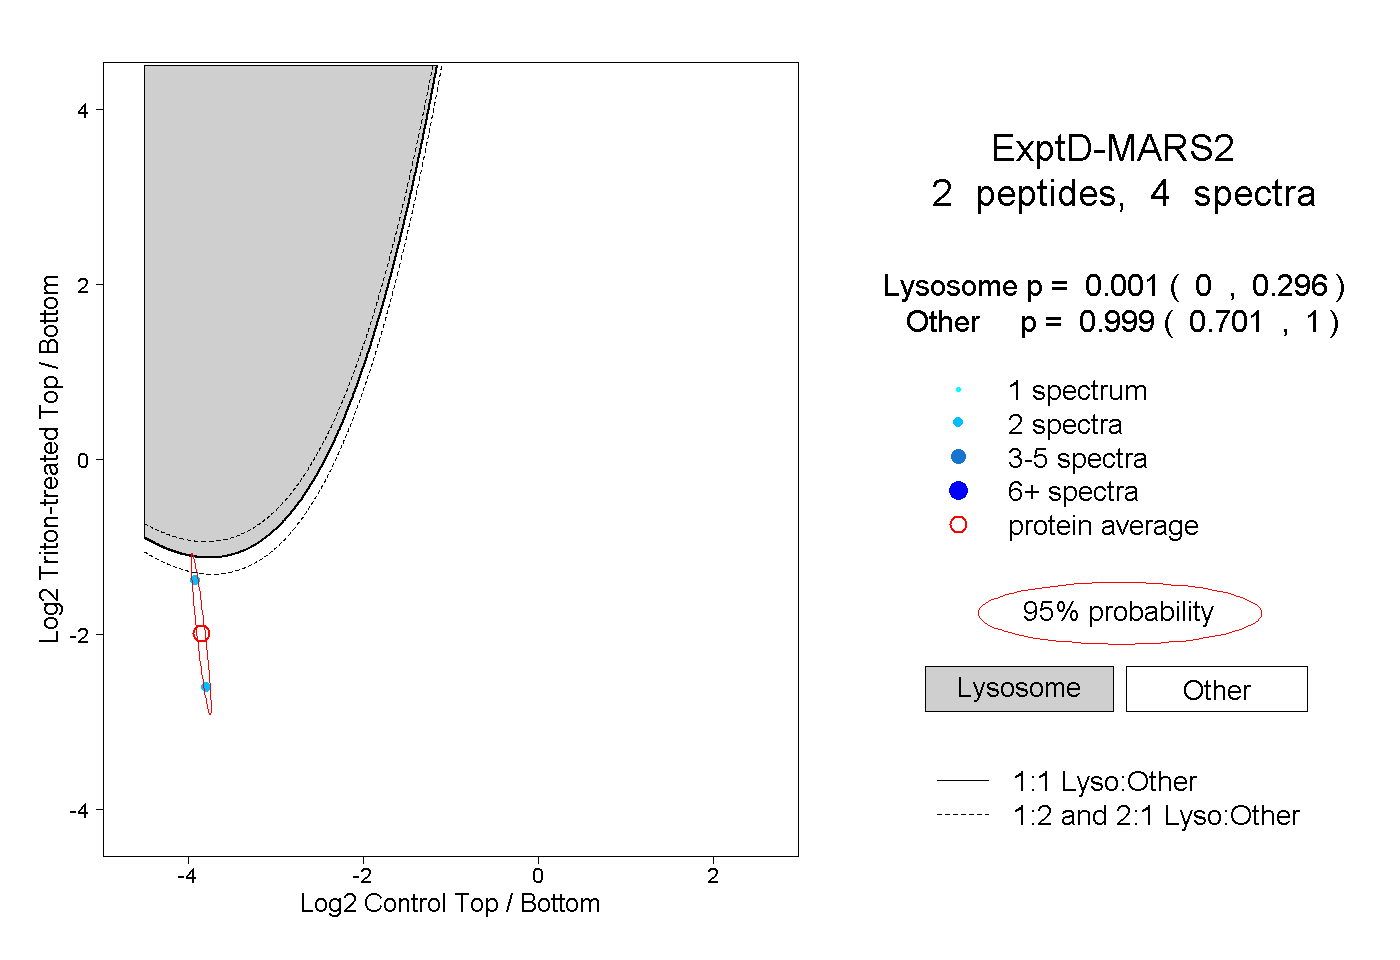
0.000 | 0.296
0.701 | 1.000