 2
2peptides
spectra

0.000 | 0.028
0.000 | 0.003
0.167 | 0.262
0.165 | 0.281
0.337 | 0.534
0.000 | 0.141
0.000 | 0.063
0.000 | 0.000
2peptides
spectra
0.000 | 0.000
1.000 | 1.000
| Plot | Mito | Lyso | Perox | ER | Golgi | PM | Cytosol | Nucleus | |||||
| Expt A |
2 peptides |
11 spectra |
|
0.000 0.000 | 0.028 |
0.000 0.000 | 0.003 |
0.236 0.167 | 0.262 |
0.225 0.165 | 0.281 |
0.482 0.337 | 0.534 |
0.025 0.000 | 0.141 |
0.032 0.000 | 0.063 |
0.000 0.000 | 0.000 |
||
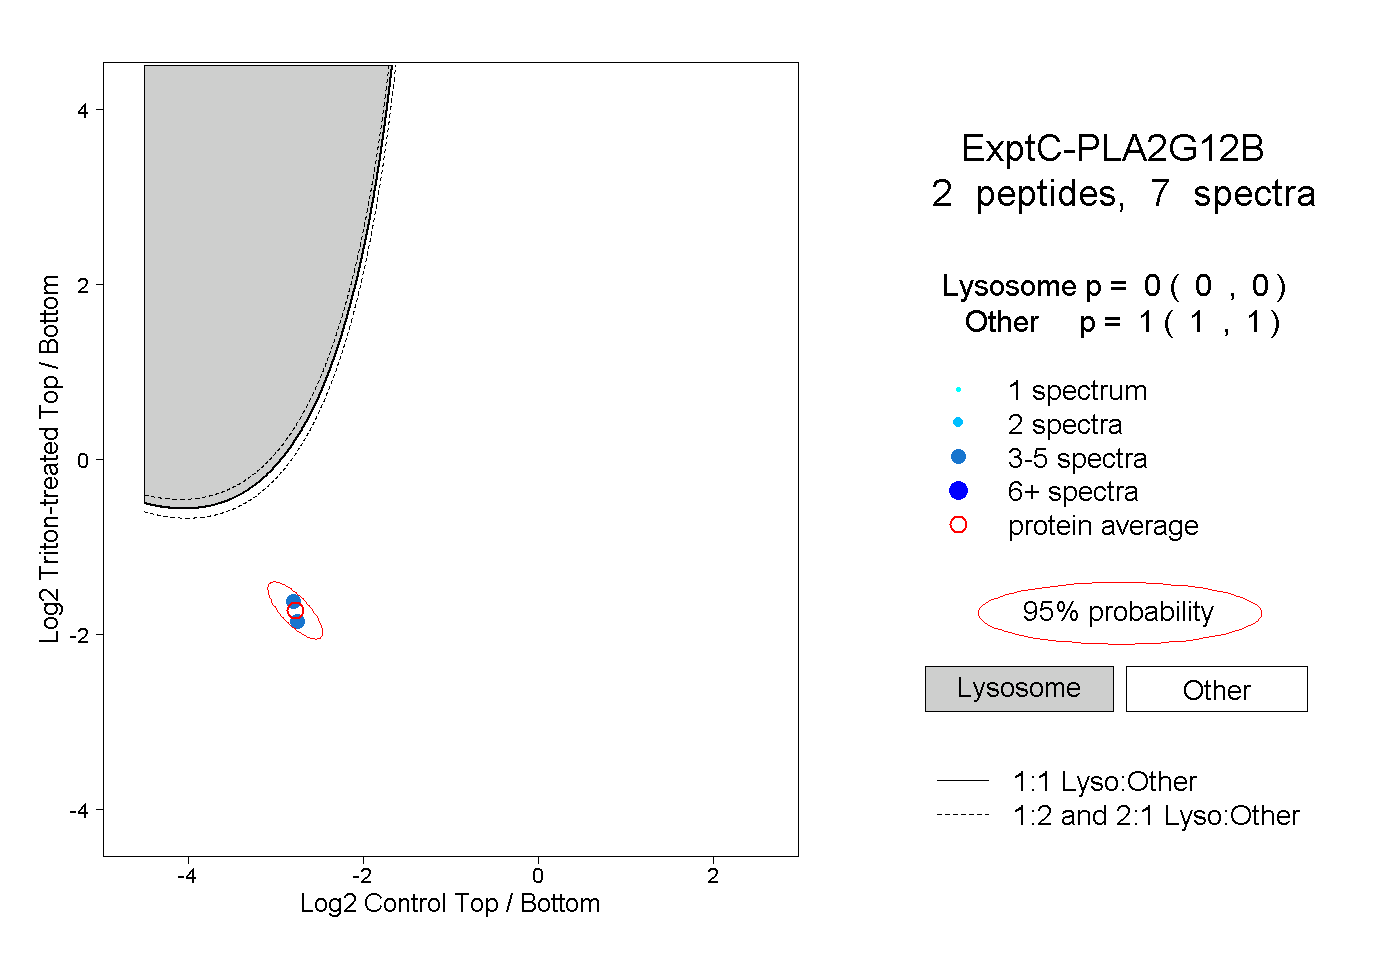
| Plot | Lyso | Other | |||||||||||
| Expt C |
2 peptides |
7 spectra |
|
0.000 0.000 | 0.000 |
1.000 1.000 | 1.000 |