EIF3I
[ENSRNOP00000067288]
Main page
| | | Plot |
Mito |
Lyso |
|
Perox |
ER |
Golgi |
PM |
Cytosol |
Nucleus |
|
| Expt A |
 11
11
peptides |
33
spectra |
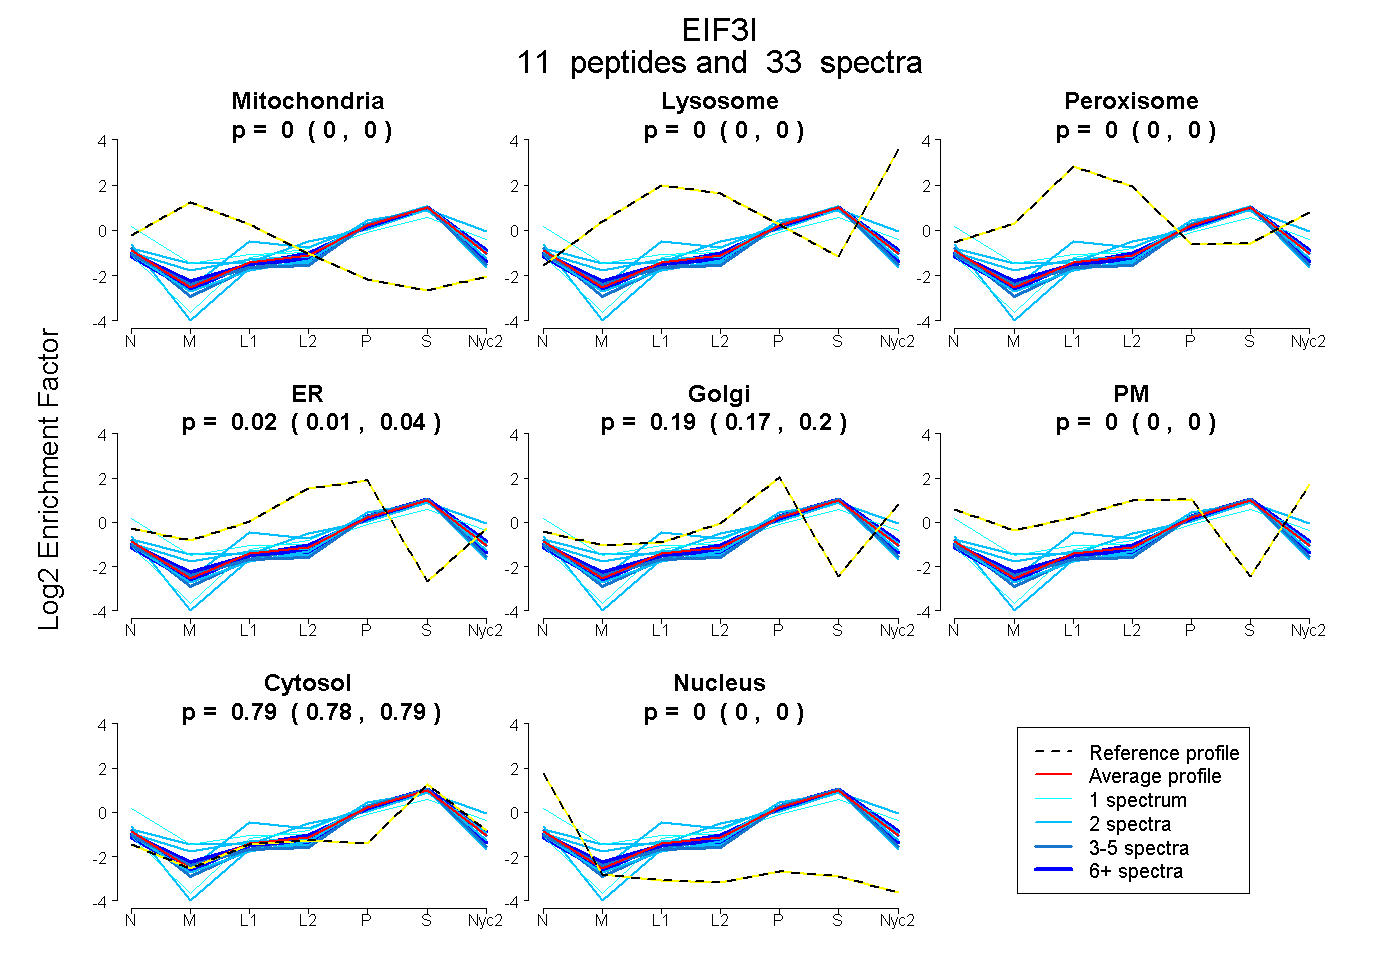 |
0.000
0.000 | 0.000 |
0.000
0.000 | 0.000 |
|
0.000
0.000 | 0.000 |
0.024
0.007 | 0.040 |
0.187
0.167 | 0.203 |
0.000
0.000 | 0.000 |
0.789
0.784 | 0.793 |
0.000
0.000 | 0.000 |
|
| | | Plot |
Mito |
|
Lyso or Perox |
|
ER |
Golgi |
PM |
Cytosol |
Nucleus |
|
| Expt B |
4
peptides |
6
spectra |
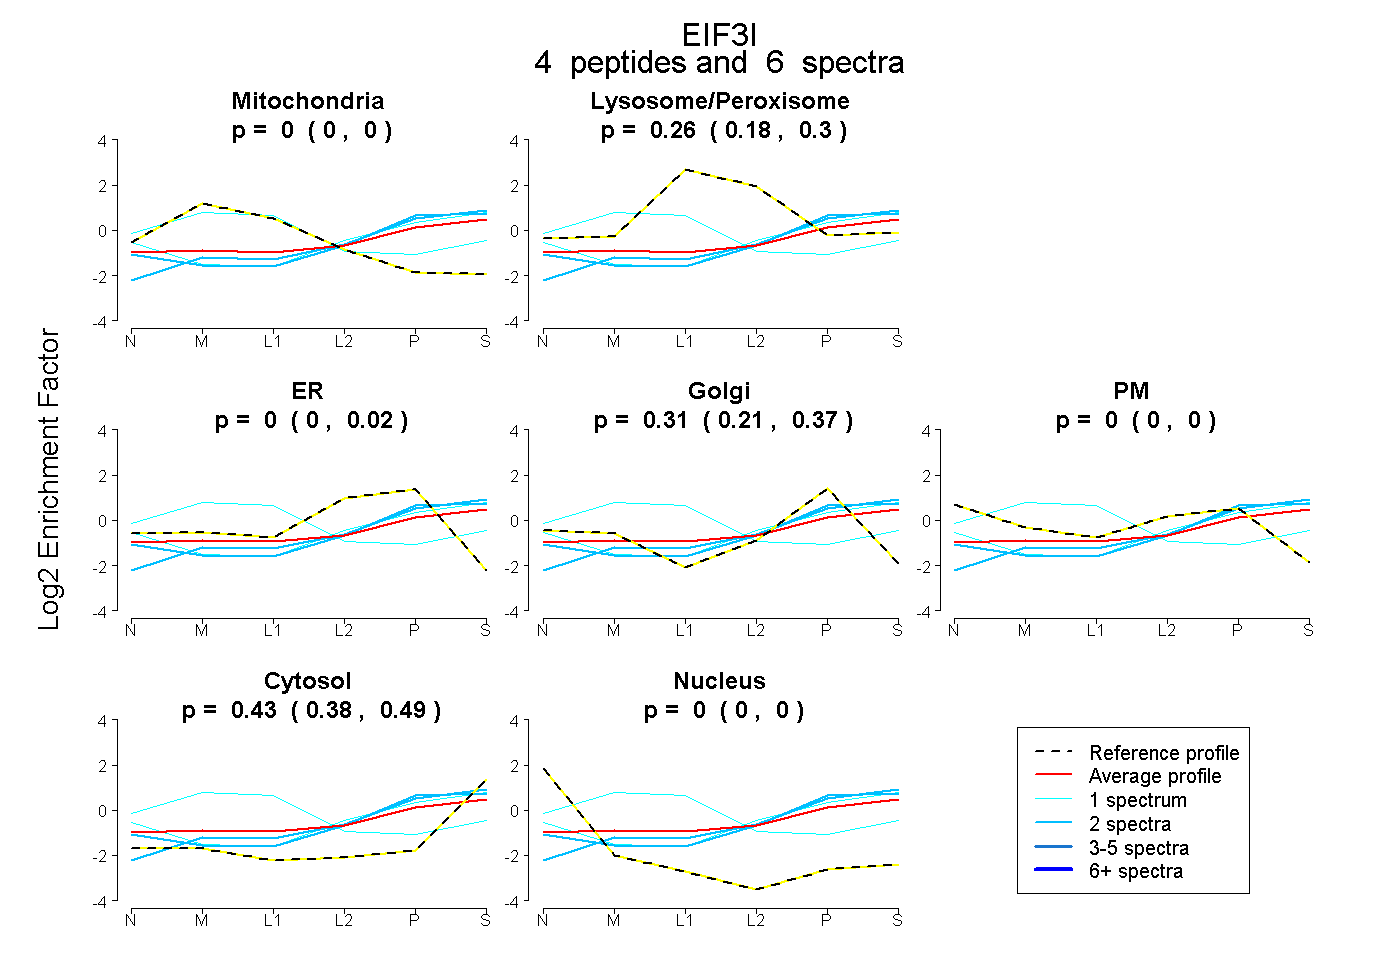 |
0.000
0.000 | 0.000 |
|
0.256
0.179 | 0.304 |
|
0.000
0.000 | 0.023 |
0.310
0.209 | 0.369 |
0.000
0.000 | 0.000 |
0.434
0.378 | 0.489 |
0.000
0.000 | 0.000 |
|
| 2 spectra, QINDIQLSR |
0.000 |
|
0.109 |
|
0.119 |
0.279 |
0.000 |
0.493 |
0.000 |
|
| 1 spectrum, EGDLLFTVAK |
0.000 |
|
0.163 |
|
0.061 |
0.307 |
0.000 |
0.469 |
0.000 |
|
| 1 spectrum, HVLTGSADNSCR |
0.577 |
|
0.205 |
|
0.000 |
0.000 |
0.045 |
0.172 |
0.000 |
|
| 2 spectra, FFHLAFEEEFGR |
0.000 |
|
0.087 |
|
0.324 |
0.000 |
0.000 |
0.589 |
0.000 |
|
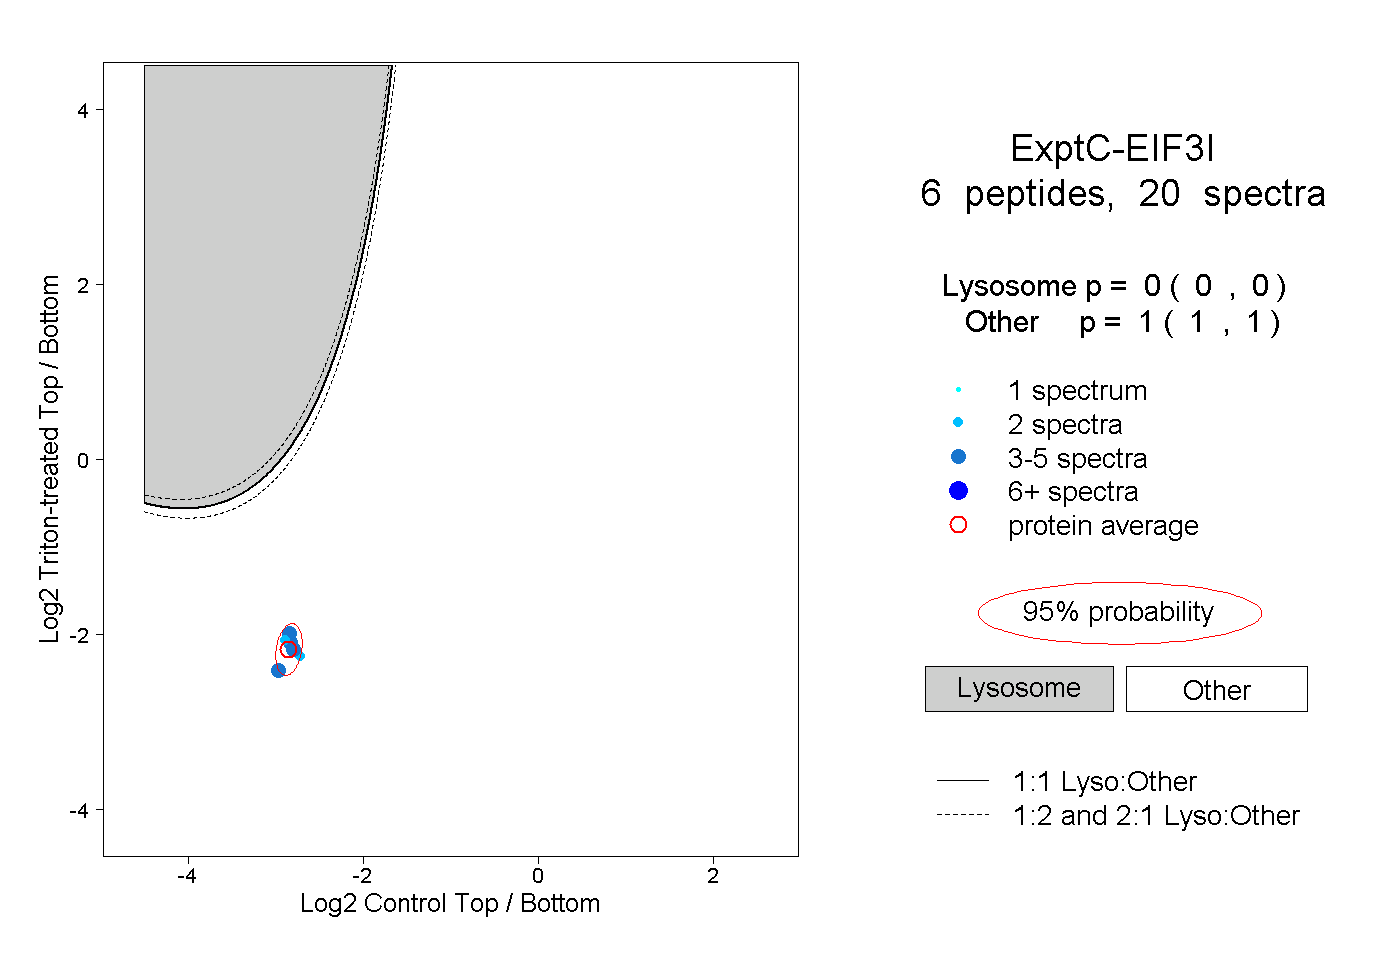
| | | Plot |
|
Lyso |
|
|
|
|
|
|
|
Other |
| Expt C |
6
peptides |
20
spectra |
 |
|
0.000
0.000 | 0.000 |
|
|
|
|
|
|
|
1.000
1.000 | 1.000 |
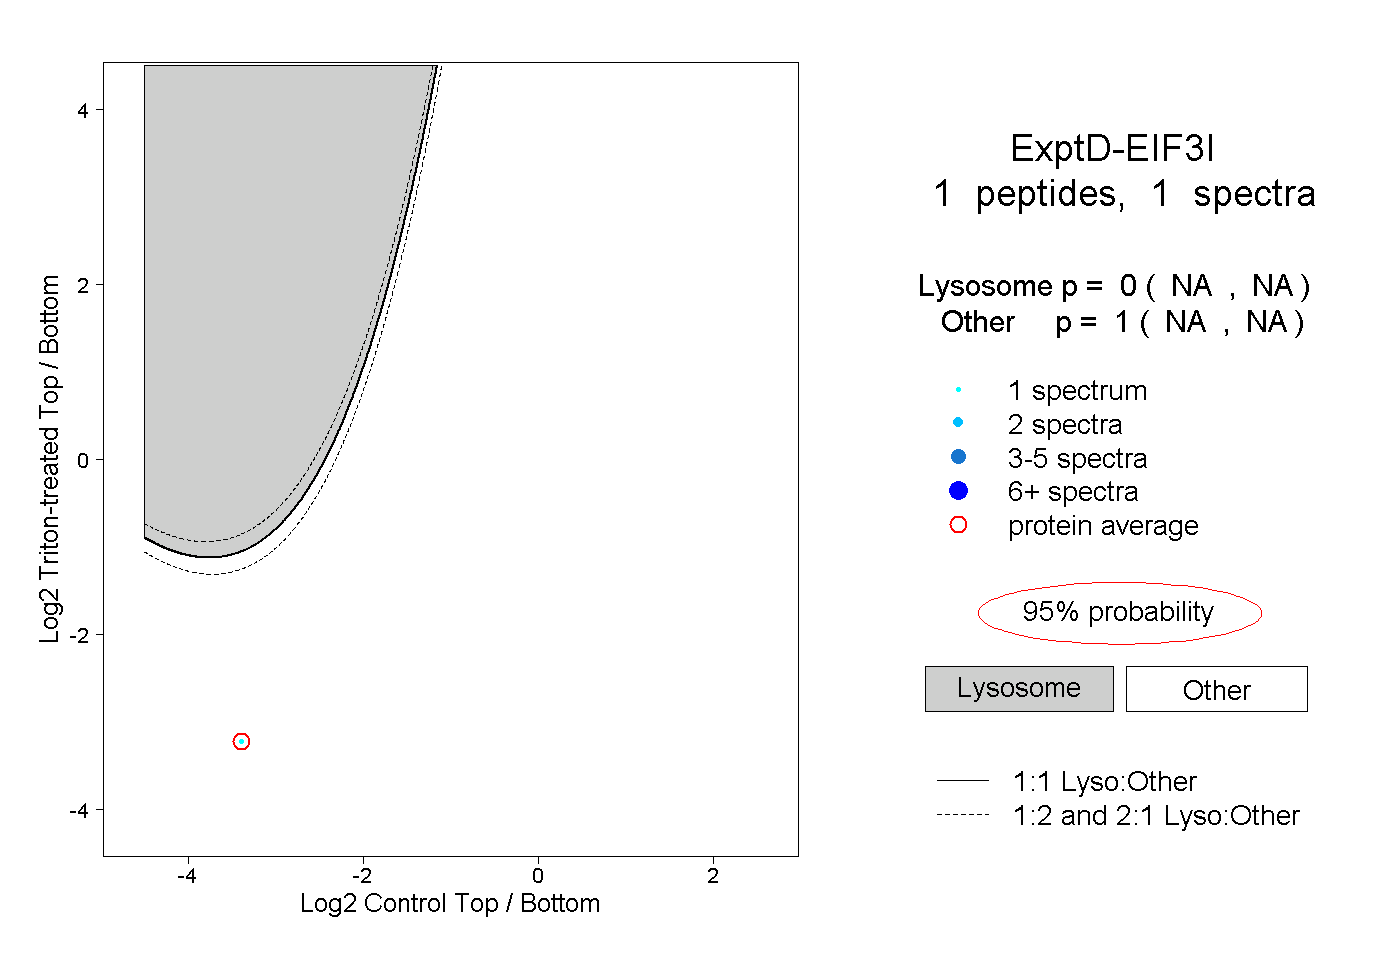
| | | Plot |
|
Lyso |
|
|
|
|
|
|
|
Other |
| Expt D |
1
peptide |
1
spectrum |
 |
|
0.000
NA | NA |
|
|
|
|
|
|
|
1.000
NA | NA |