 3
3peptides
spectra
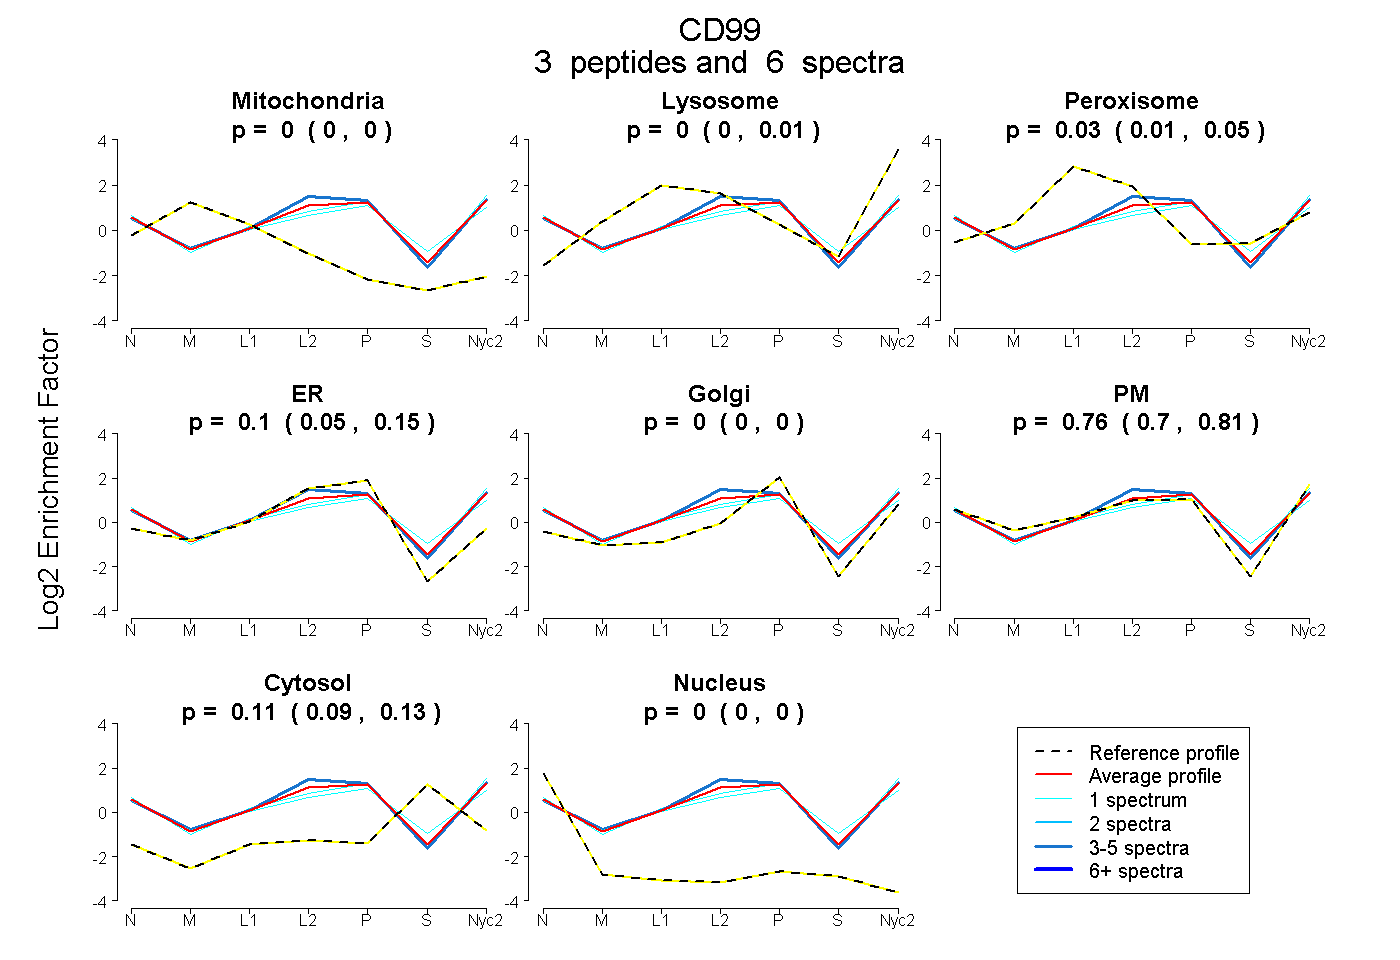
0.000 | 0.000
0.000 | 0.005
0.006 | 0.053
0.046 | 0.149
0.000 | 0.000
0.697 | 0.806
0.087 | 0.128
0.000 | 0.000
| Plot | Mito | Lyso | Perox | ER | Golgi | PM | Cytosol | Nucleus | |||||
| Expt A |
3 peptides |
6 spectra |
|
0.000 0.000 | 0.000 |
0.000 0.000 | 0.005 |
0.032 0.006 | 0.053 |
0.102 0.046 | 0.149 |
0.000 0.000 | 0.000 |
0.757 0.697 | 0.806 |
0.109 0.087 | 0.128 |
0.000 0.000 | 0.000 |
| 1 spectrum, EGGSAPV | 0.000 | 0.000 | 0.049 | 0.061 | 0.000 | 0.686 | 0.204 | 0.000 | ||
| 4 spectra, DSGGISDR | 0.000 | 0.018 | 0.037 | 0.181 | 0.000 | 0.710 | 0.054 | 0.000 | ||
| 1 spectrum, DLEDVAGHGGR | 0.000 | 0.000 | 0.000 | 0.000 | 0.025 | 0.871 | 0.104 | 0.000 |
| Plot | Lyso | Other | |||||||||||
| Expt C |
1 peptide |
4 spectra |
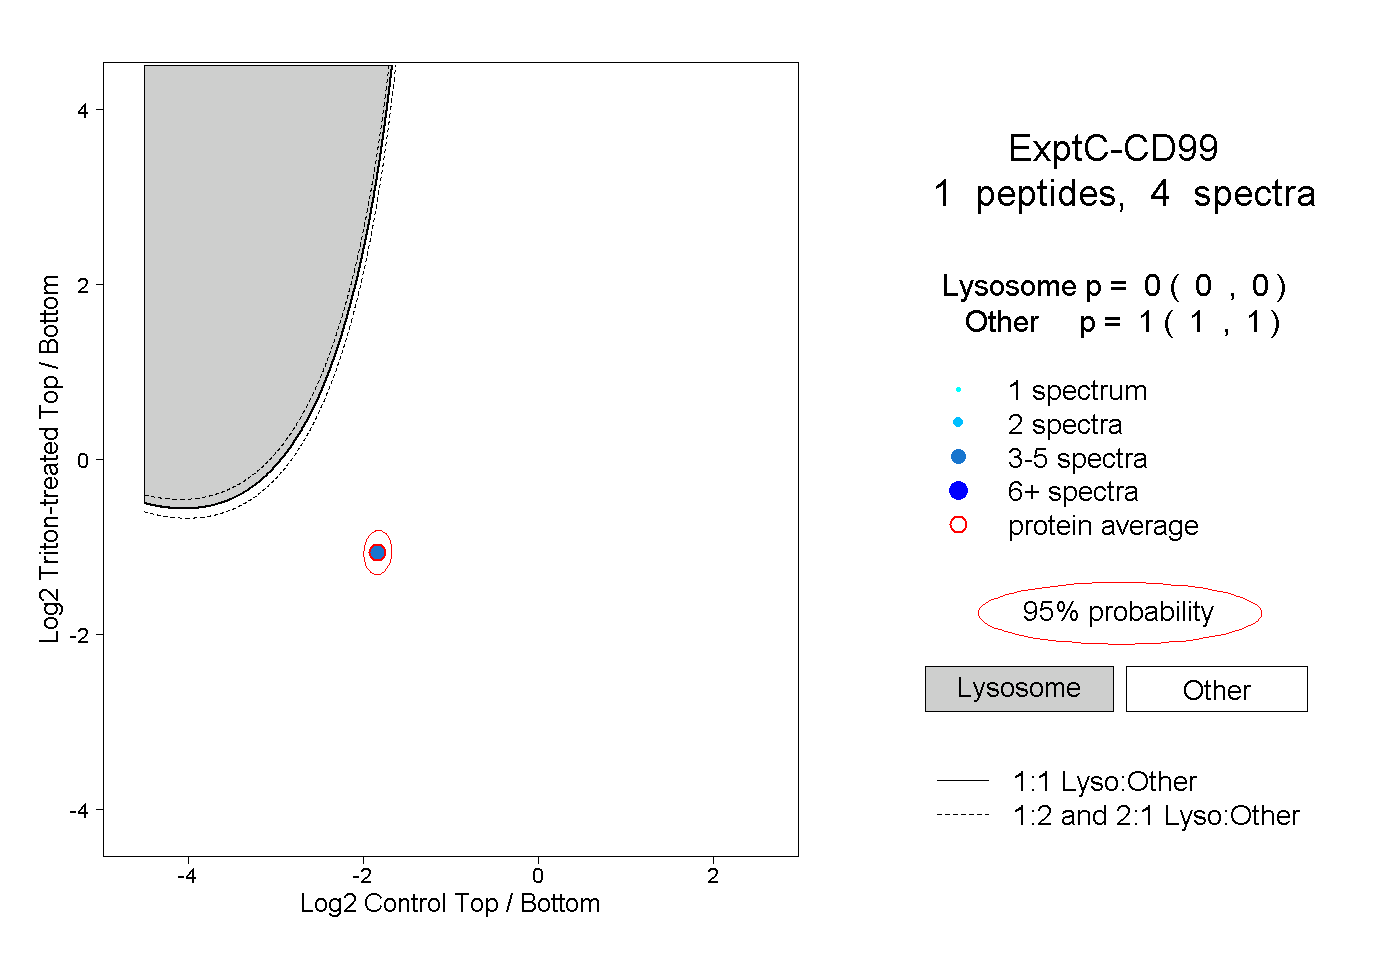 |
0.000 0.000 | 0.000 |
1.000 1.000 | 1.000 |