 20
20peptides
spectra
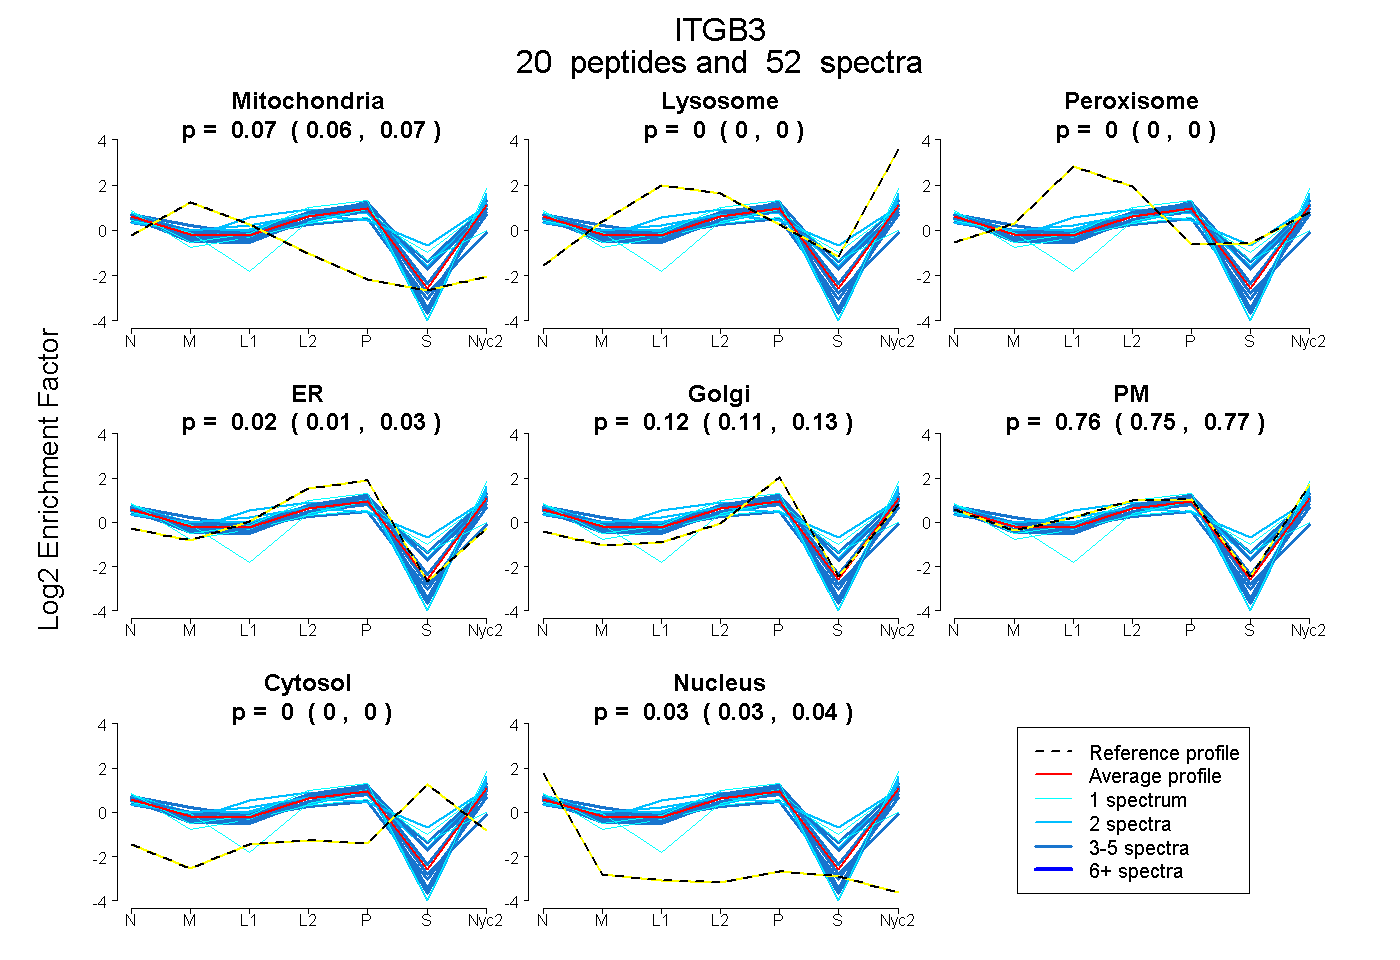
0.064 | 0.071
0.000 | 0.000
0.000 | 0.000
0.010 | 0.031
0.108 | 0.125
0.750 | 0.768
0.000 | 0.000
0.031 | 0.036
9peptides
spectra
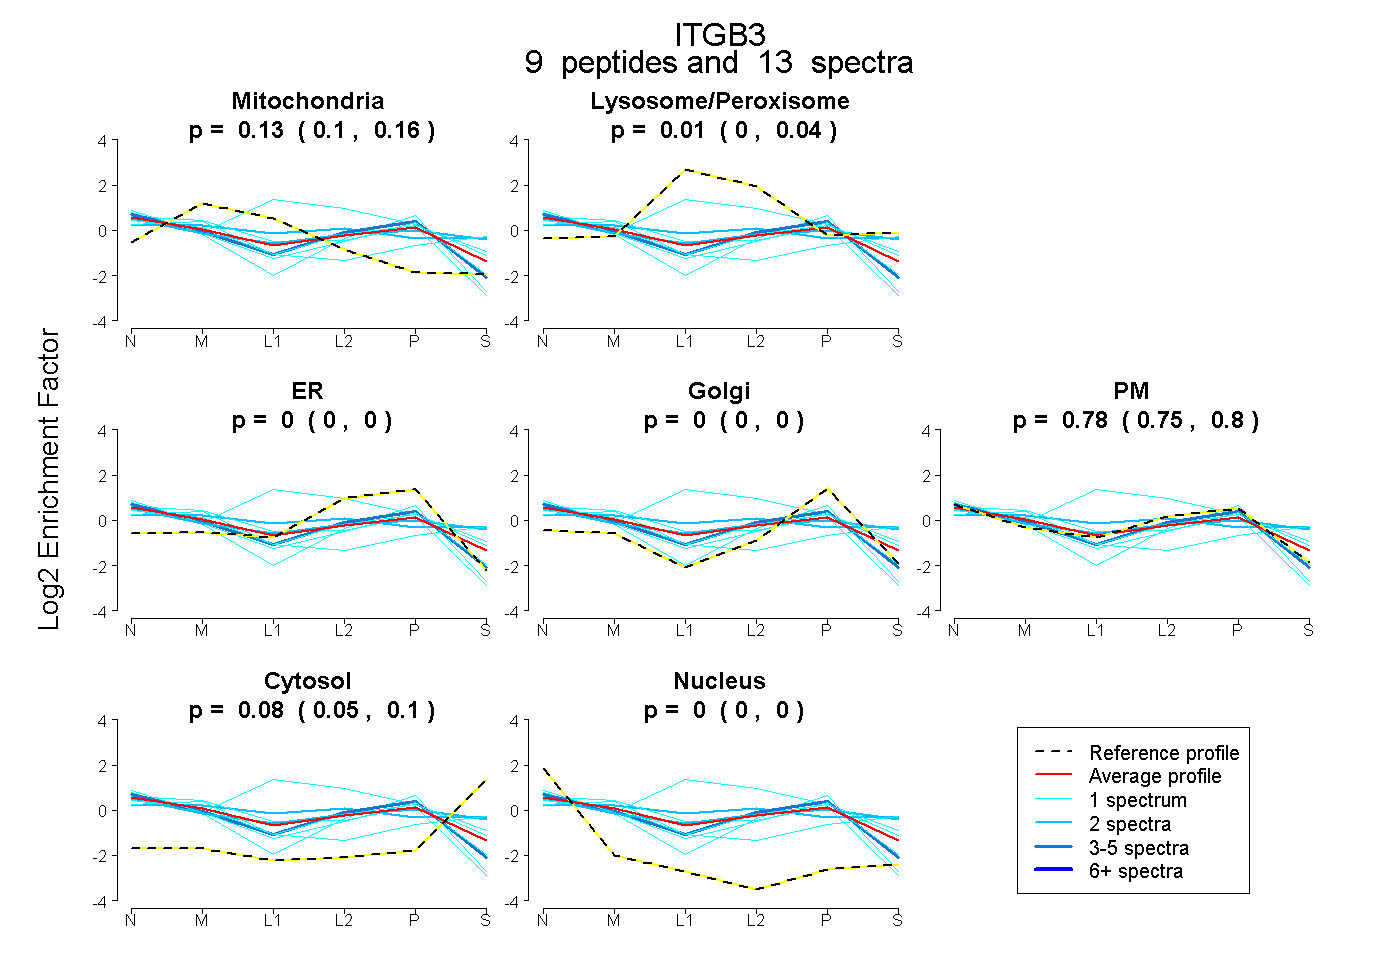
0.097 | 0.159
0.000 | 0.039
0.000 | 0.000
0.000 | 0.000
0.746 | 0.804
0.046 | 0.098
0.000 | 0.004
21peptides
spectra
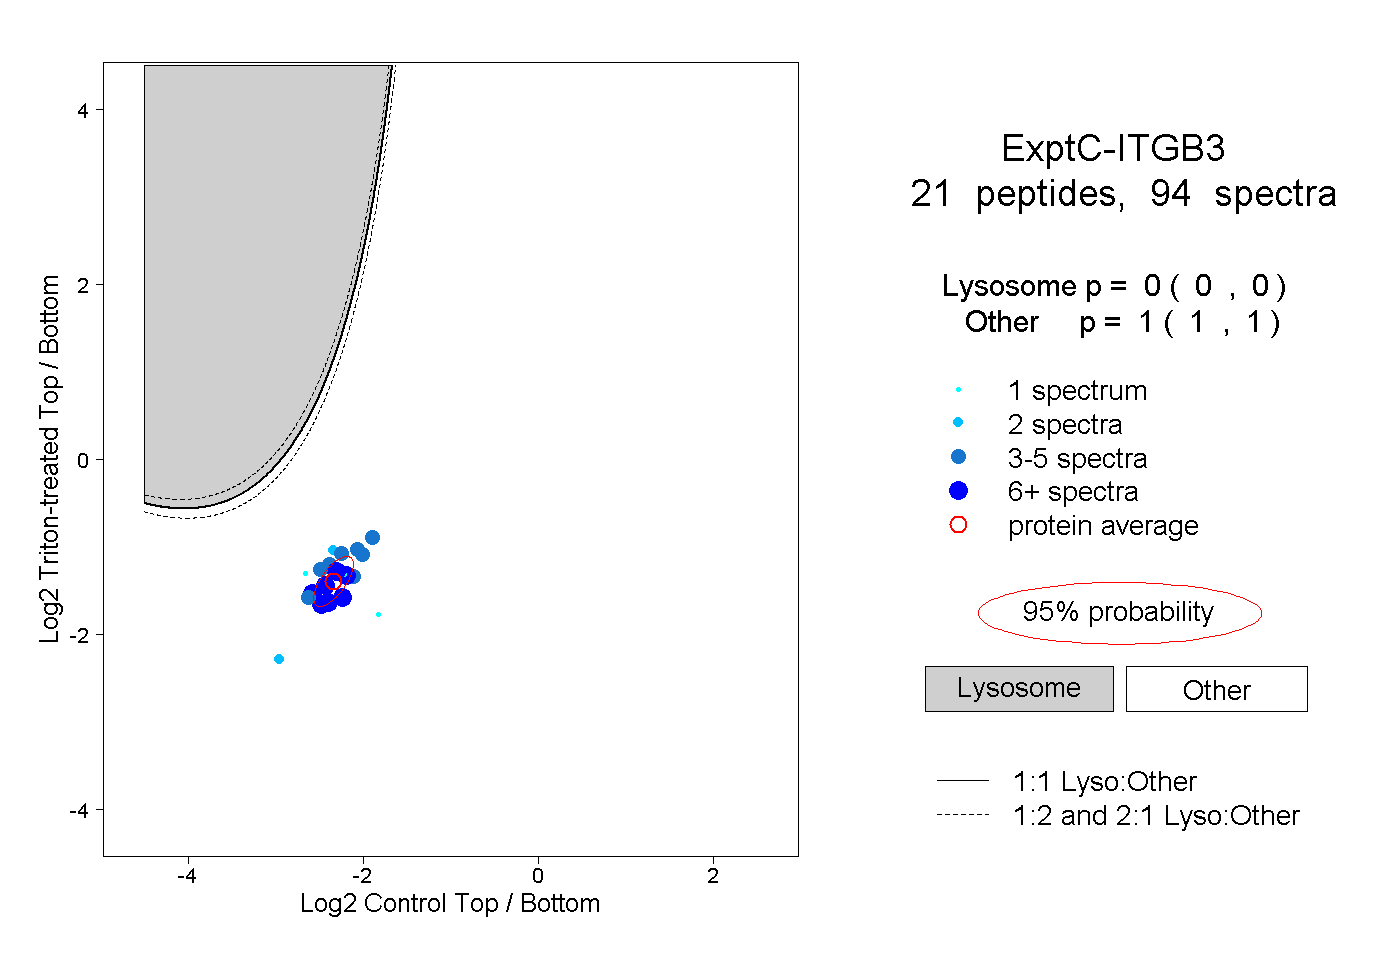
0.000 | 0.000
1.000 | 1.000
6peptides
spectra
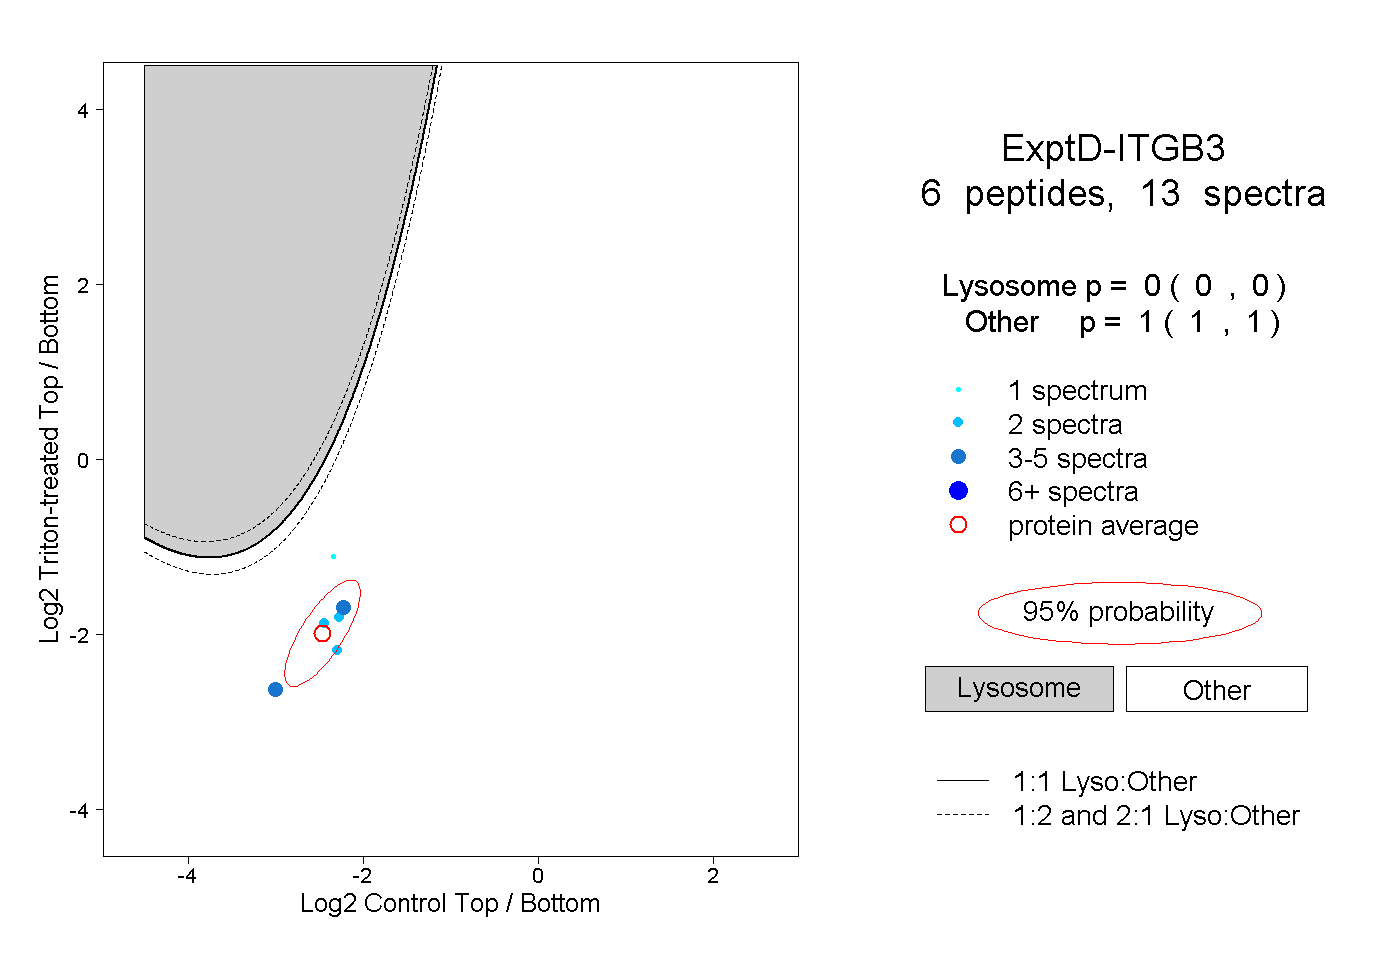
0.000 | 0.000
1.000 | 1.000