 18
18peptides
spectra
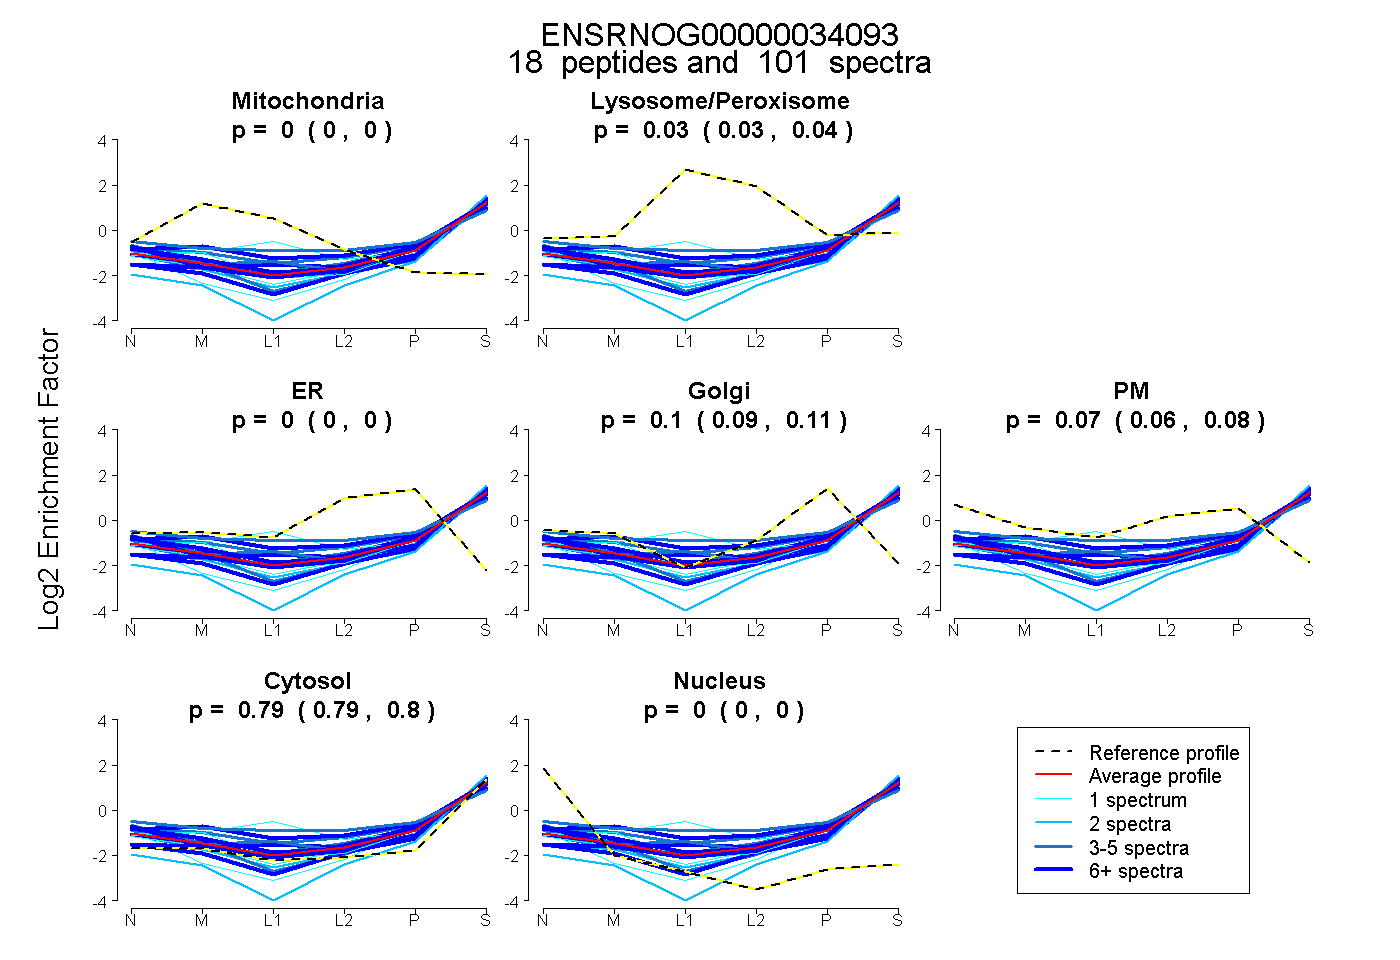
0.000 | 0.000
0.028 | 0.040
0.000 | 0.000
0.089 | 0.107
0.059 | 0.083
0.792 | 0.797
0.000 | 0.000
24peptides
spectra
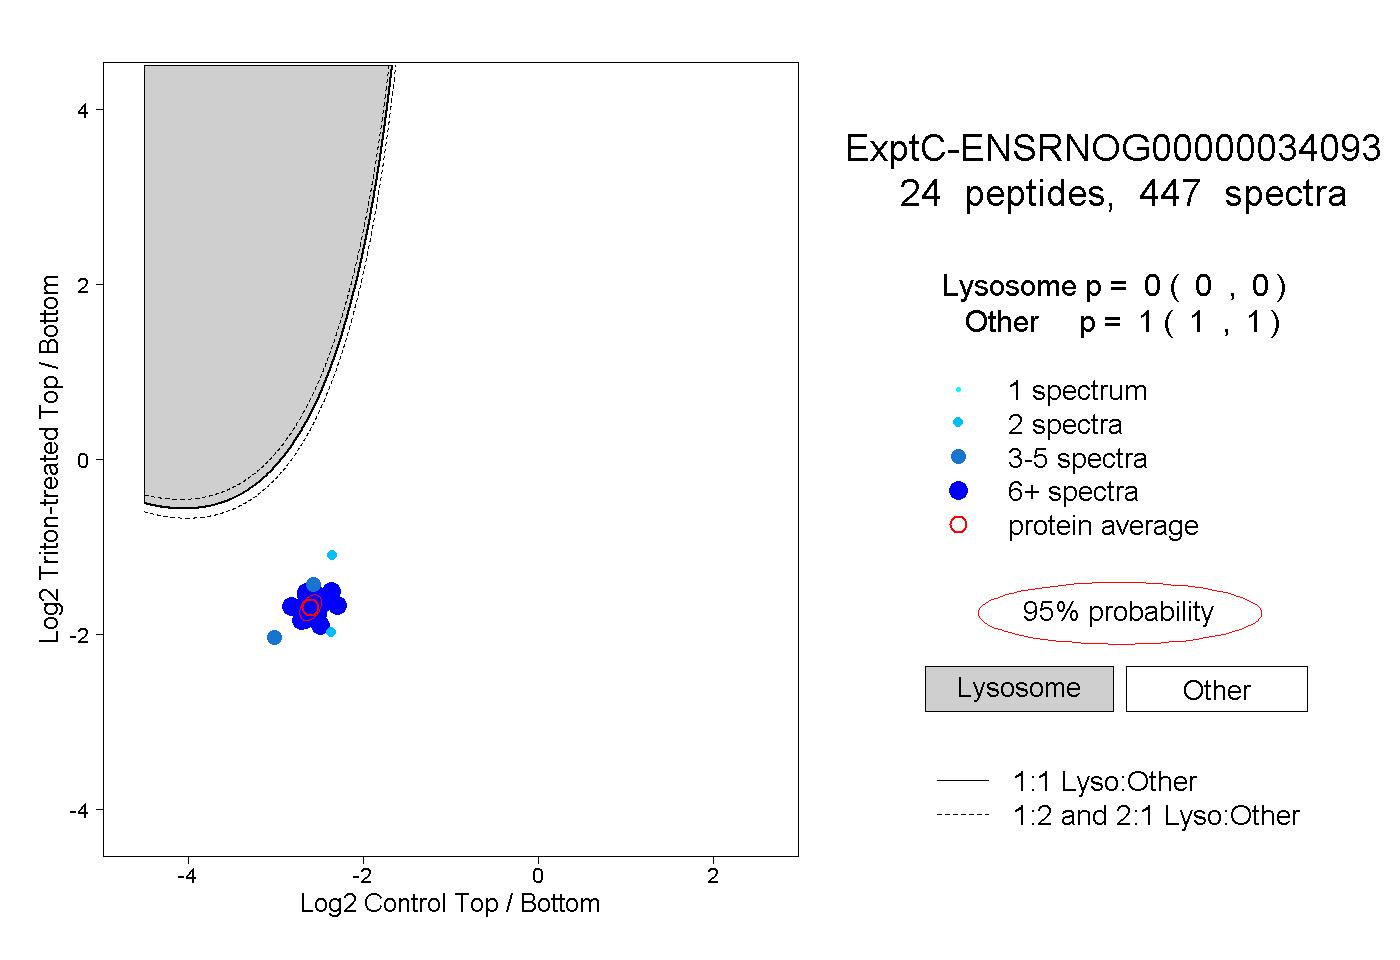
0.000 | 0.000
1.000 | 1.000
9peptides
spectra
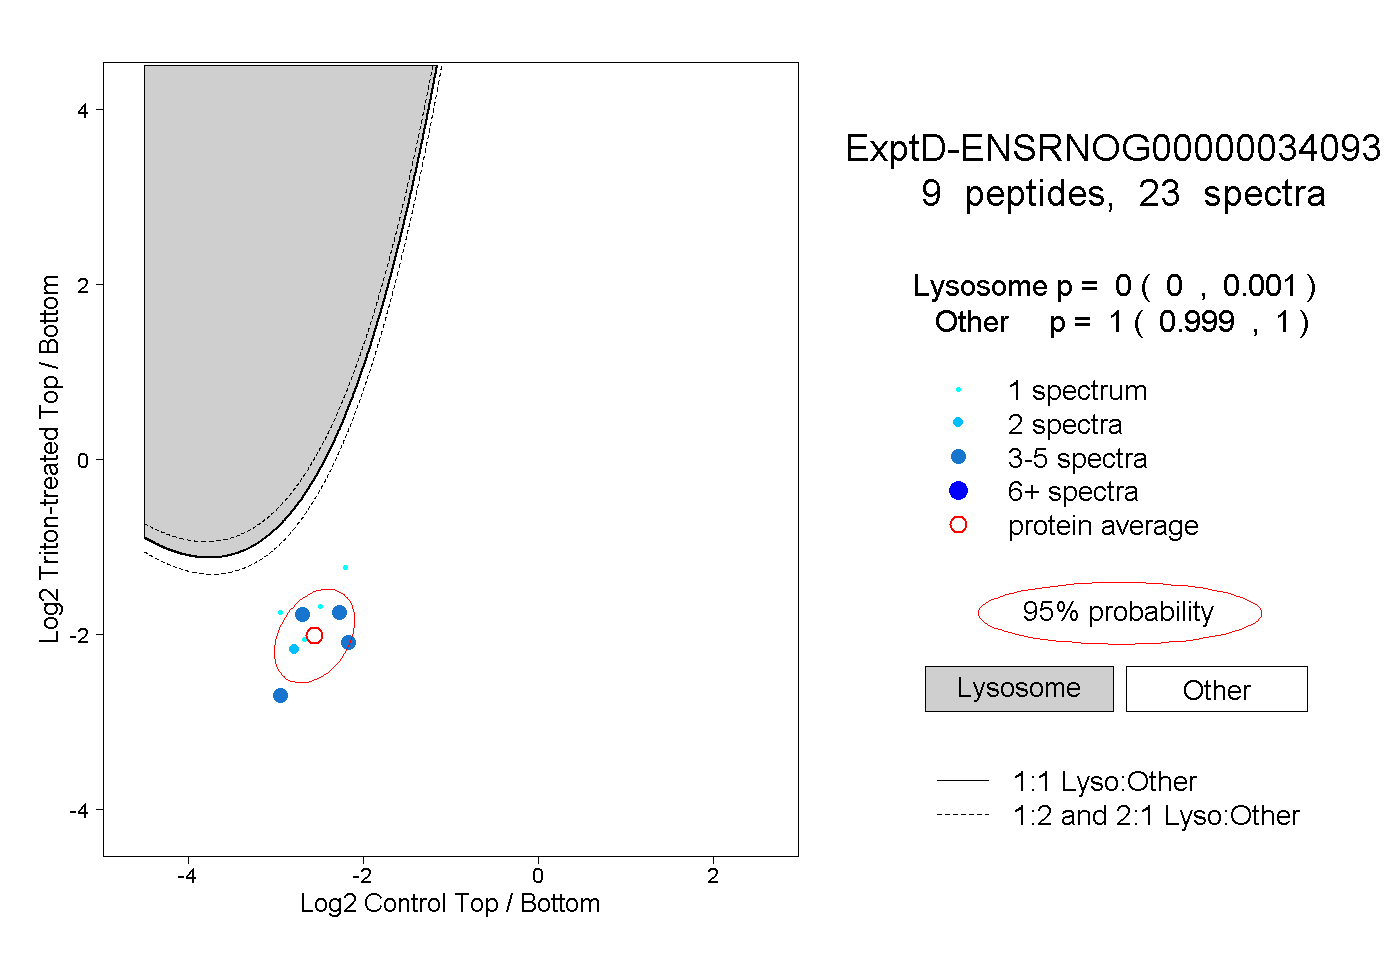
0.000 | 0.001
0.999 | 1.000