 8
8peptides
spectra
0.000 | 0.000
0.000 | 0.000
0.000 | 0.000
0.000 | 0.074
0.534 | 0.661
0.000 | 0.000
0.218 | 0.291
0.072 | 0.125
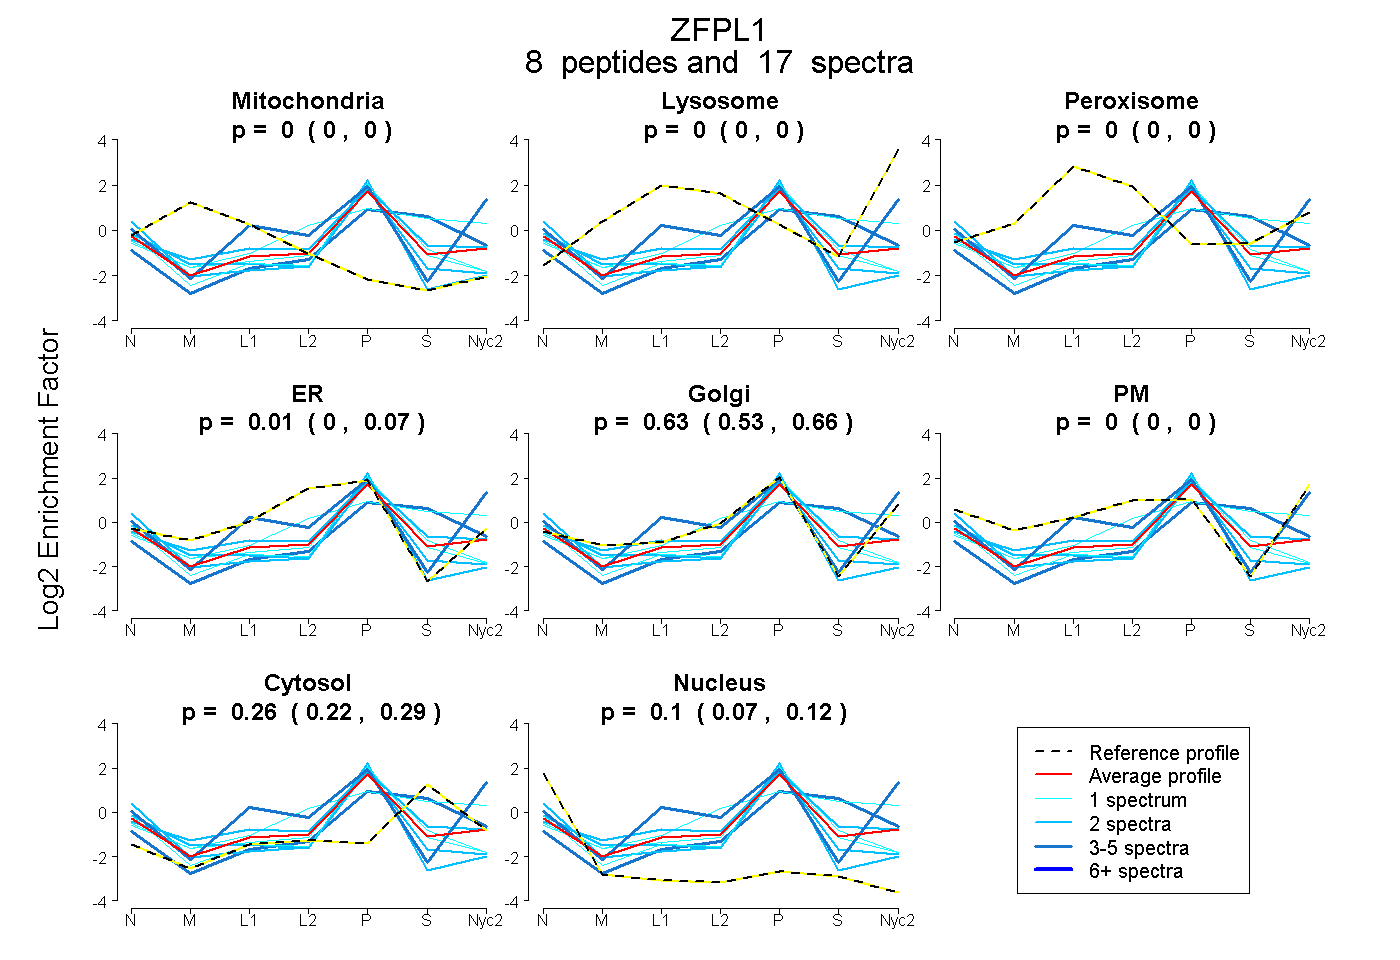
| Plot | Mito | Lyso | Perox | ER | Golgi | PM | Cytosol | Nucleus | |||||
| Expt A |
8 peptides |
17 spectra |
|
0.000 0.000 | 0.000 |
0.000 0.000 | 0.000 |
0.000 0.000 | 0.000 |
0.009 0.000 | 0.074 |
0.633 0.534 | 0.661 |
0.000 0.000 | 0.000 |
0.257 0.218 | 0.291 |
0.101 0.072 | 0.125 |
| 2 spectra, LCNTPLASR | 0.000 | 0.000 | 0.000 | 0.087 | 0.608 | 0.000 | 0.000 | 0.305 | ||
| 1 spectrum, AAQLPR | 0.000 | 0.000 | 0.000 | 0.173 | 0.407 | 0.000 | 0.287 | 0.133 | ||
| 1 spectrum, LVCYDLFHWACINER | 0.000 | 0.000 | 0.000 | 0.013 | 0.556 | 0.000 | 0.212 | 0.219 | ||
| 1 spectrum, RPLTLLQR | 0.000 | 0.077 | 0.000 | 0.135 | 0.265 | 0.032 | 0.492 | 0.000 | ||
| 3 spectra, AAADSDPNLDPLMNPHIR | 0.000 | 0.000 | 0.000 | 0.000 | 0.320 | 0.000 | 0.680 | 0.000 | ||
| 5 spectra, VTNLFCFEHR | 0.000 | 0.030 | 0.000 | 0.000 | 0.722 | 0.208 | 0.039 | 0.000 | ||
| 2 spectra, LATVNWAR | 0.000 | 0.000 | 0.000 | 0.000 | 0.615 | 0.000 | 0.053 | 0.332 | ||
| 2 spectra, VNVCEHCLVANHAK | 0.000 | 0.000 | 0.000 | 0.127 | 0.529 | 0.000 | 0.325 | 0.019 |
| Plot | Mito | Lyso or Perox | ER | Golgi | PM | Cytosol | Nucleus | ||||||
| Expt B |
1 peptide |
2 spectra |
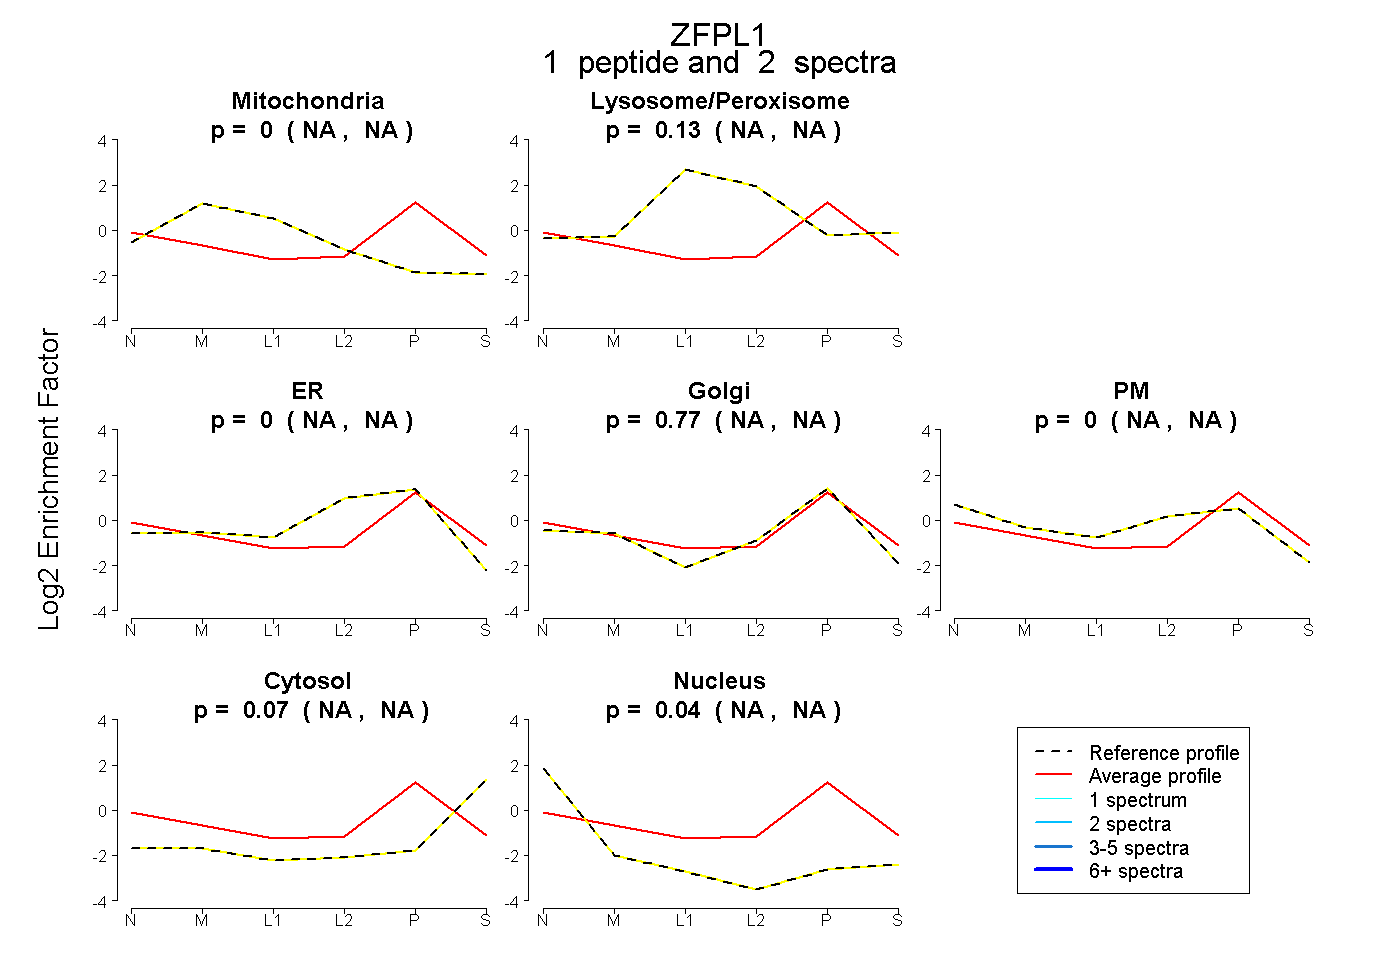 |
0.000 NA | NA |
0.126 NA | NA |
0.000 NA | NA |
0.766 NA | NA |
0.000 NA | NA |
0.065 NA | NA |
0.043 NA | NA |
|||
| Plot | Lyso | Other | |||||||||||
| Expt C |
3 peptides |
6 spectra |
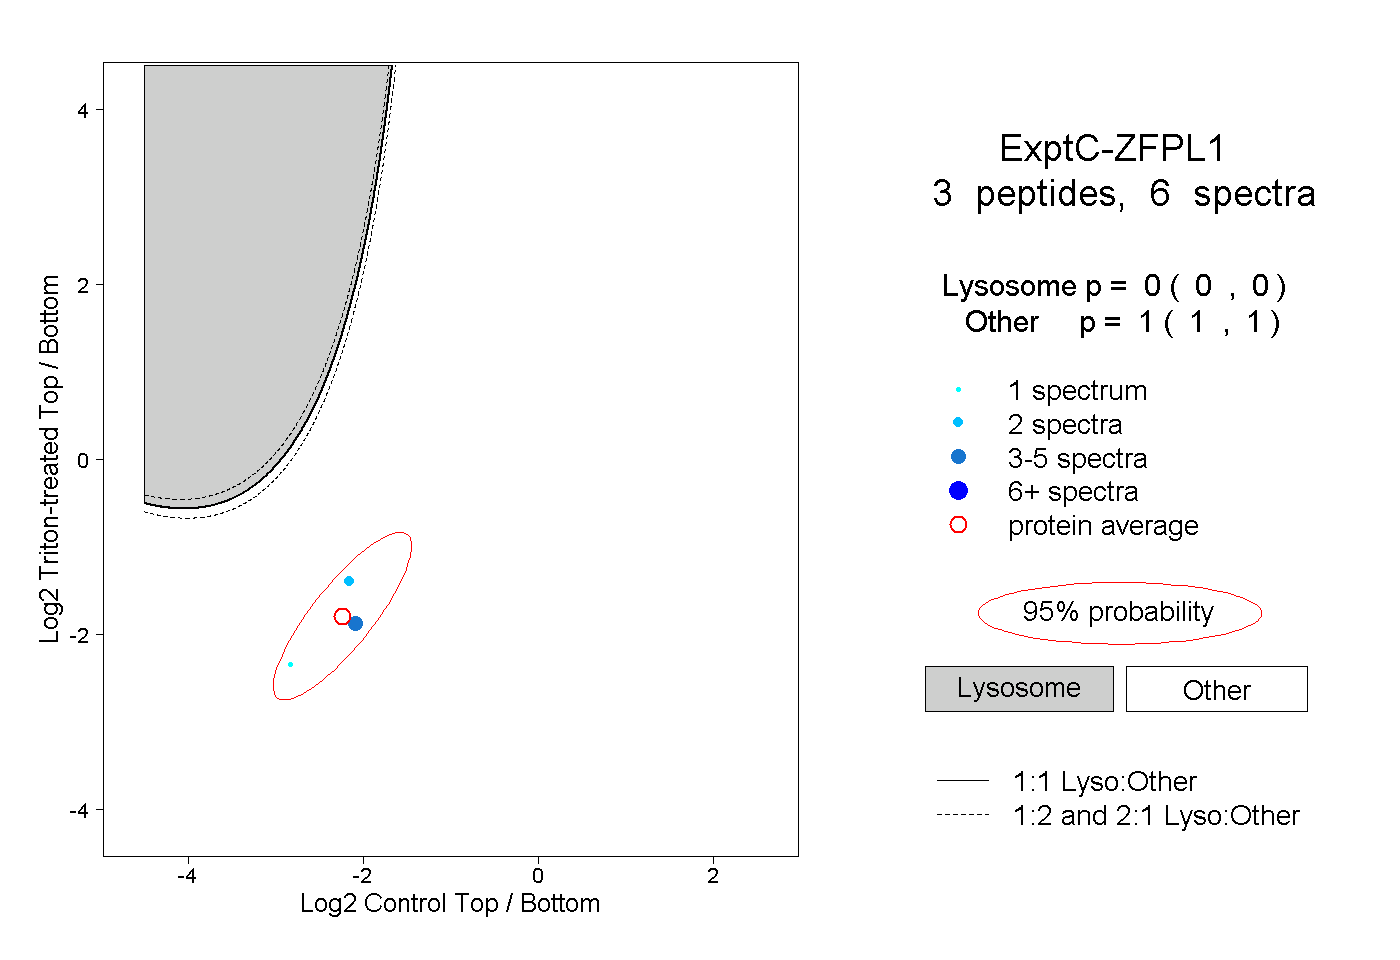 |
0.000 0.000 | 0.000 |
1.000 1.000 | 1.000 |