 8
8peptides
spectra
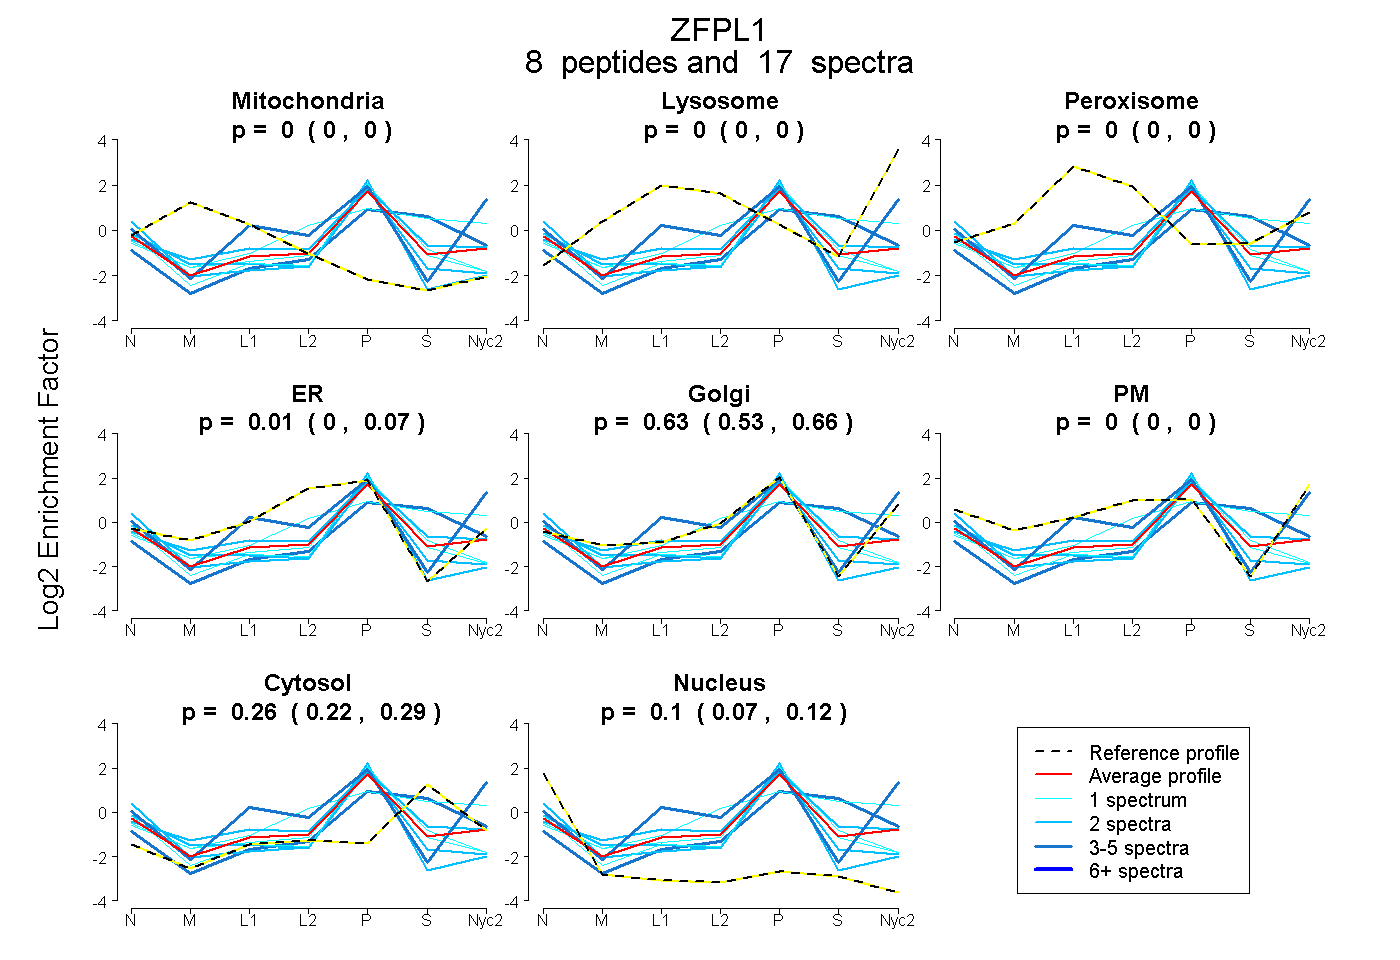
0.000 | 0.000
0.000 | 0.000
0.000 | 0.000
0.000 | 0.074
0.534 | 0.661
0.000 | 0.000
0.218 | 0.291
0.072 | 0.125
1peptide
spectra
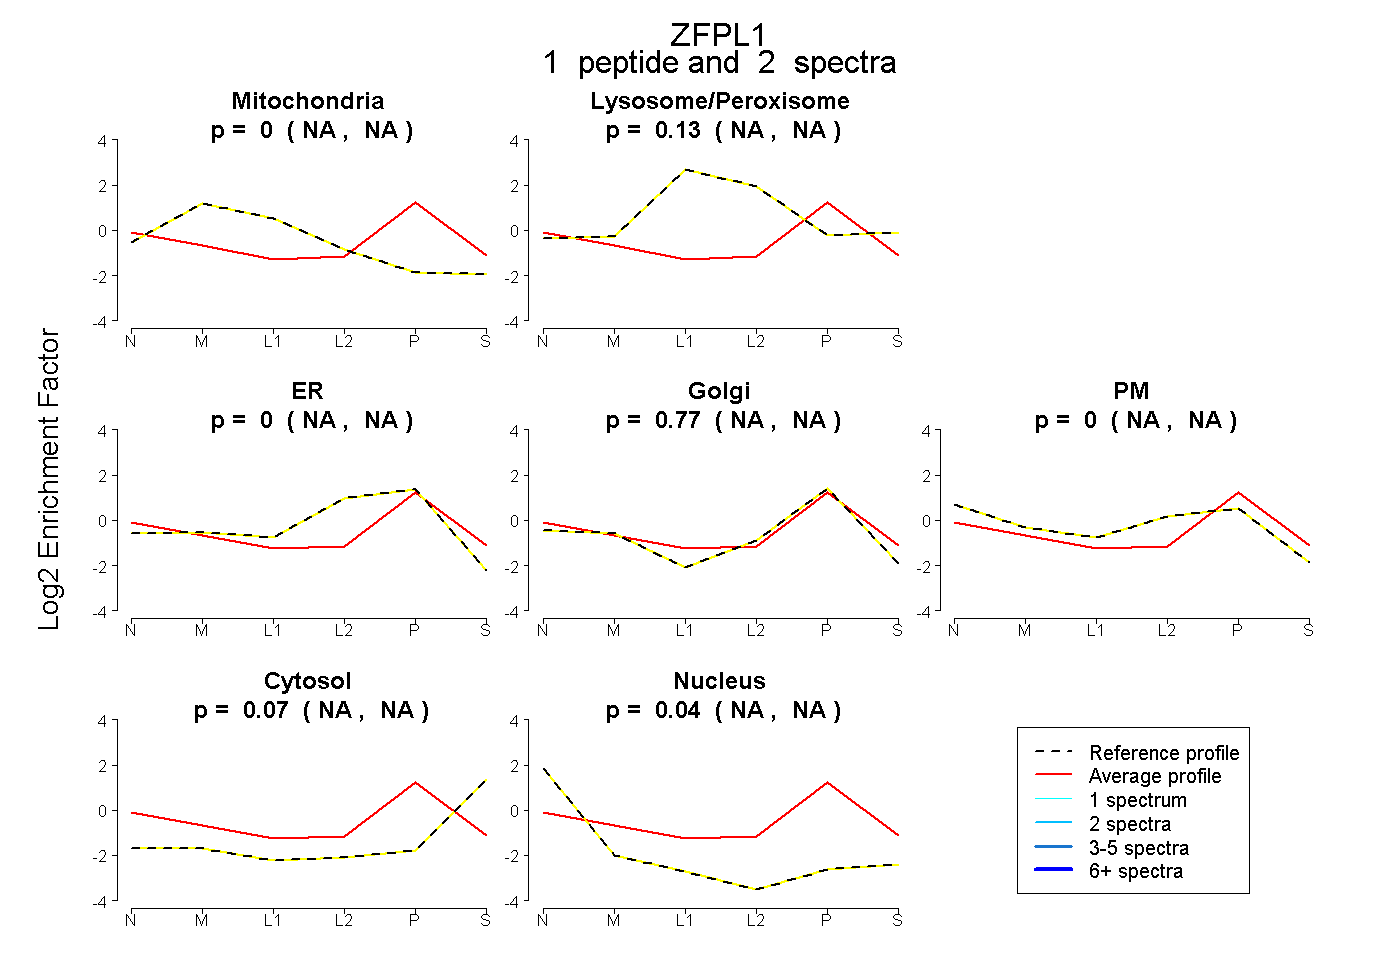
NA | NA
NA | NA
NA | NA
NA | NA
NA | NA
NA | NA
NA | NA
3peptides
spectra
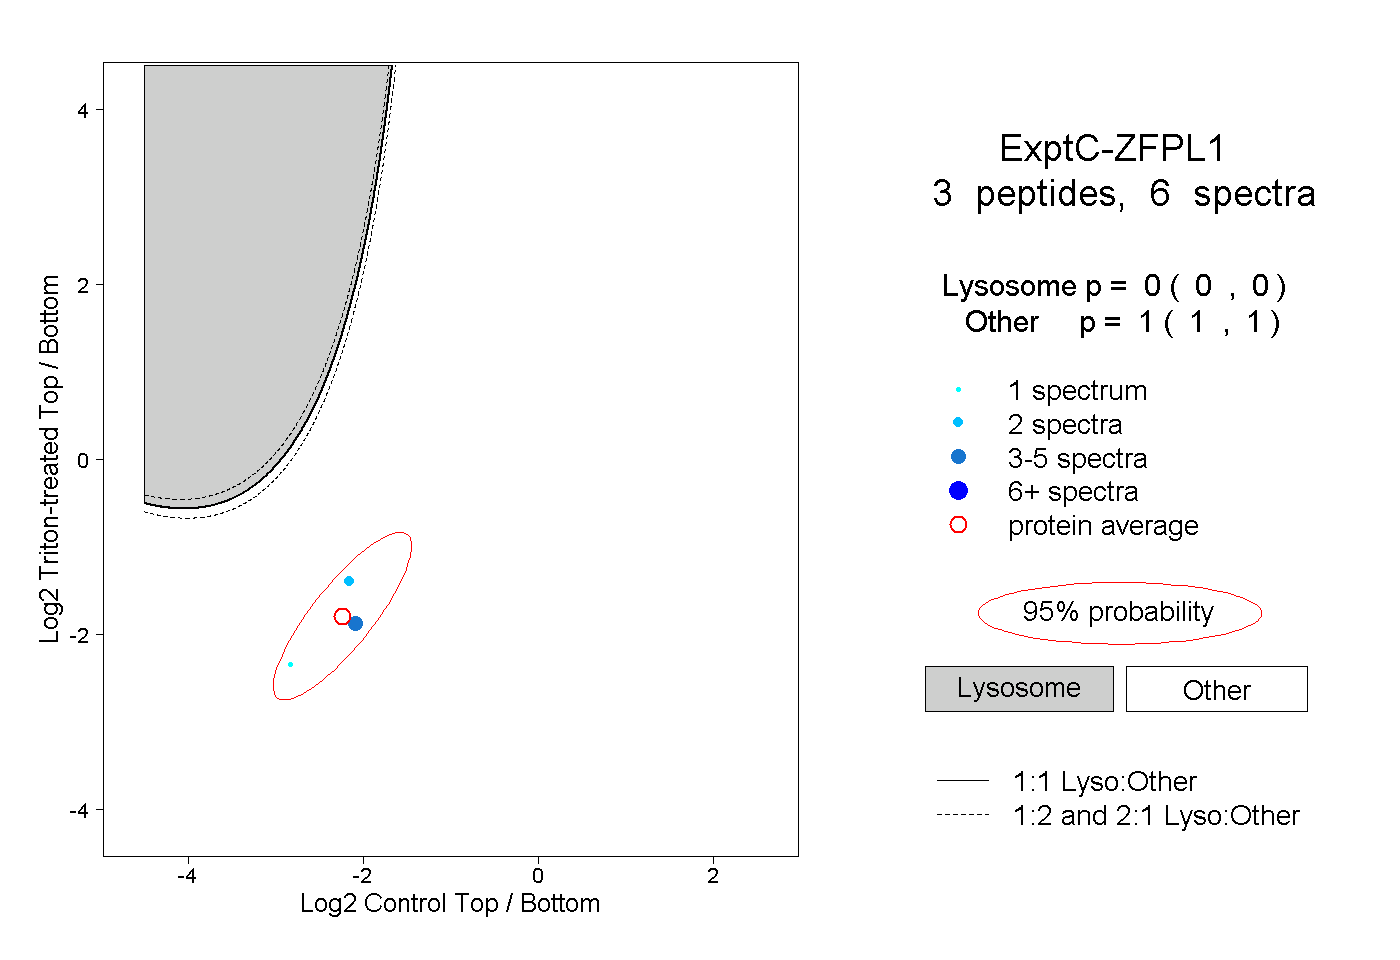
0.000 | 0.000
1.000 | 1.000