 4
4peptides
spectra
0.000 | 0.000
0.000 | 0.000
0.008 | 0.065
0.030 | 0.131
0.000 | 0.034
0.783 | 0.877
0.000 | 0.057
0.000 | 0.005
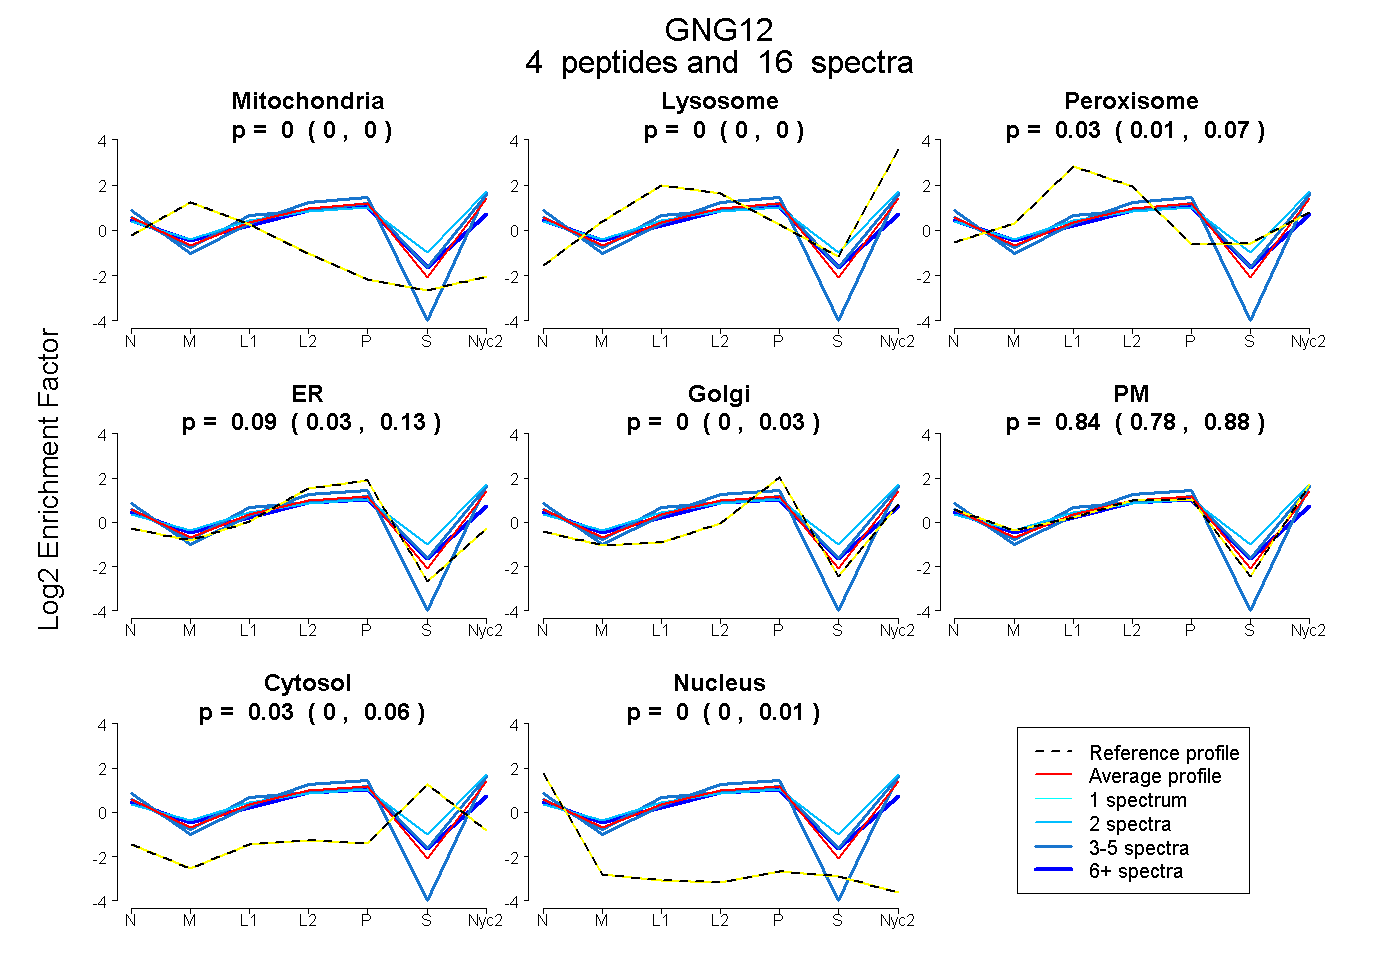
| Plot | Mito | Lyso | Perox | ER | Golgi | PM | Cytosol | Nucleus | |||||
| Expt A |
4 peptides |
16 spectra |
|
0.000 0.000 | 0.000 |
0.000 0.000 | 0.000 |
0.033 0.008 | 0.065 |
0.092 0.030 | 0.131 |
0.000 0.000 | 0.034 |
0.840 0.783 | 0.877 |
0.035 0.000 | 0.057 |
0.000 0.000 | 0.005 |
| 6 spectra, ASADLMSYCEEHAR | 0.000 | 0.000 | 0.100 | 0.229 | 0.000 | 0.564 | 0.098 | 0.010 | ||
| 5 spectra, TASTNSTAQAR | 0.000 | 0.000 | 0.000 | 0.144 | 0.000 | 0.856 | 0.000 | 0.000 | ||
| 2 spectra, TVQQLR | 0.000 | 0.138 | 0.065 | 0.000 | 0.000 | 0.672 | 0.126 | 0.000 | ||
| 3 spectra, SDPLLMGIPTSENPFK | 0.000 | 0.014 | 0.117 | 0.000 | 0.041 | 0.777 | 0.050 | 0.000 |
| Plot | Lyso | Other | |||||||||||
| Expt C |
4 peptides |
22 spectra |
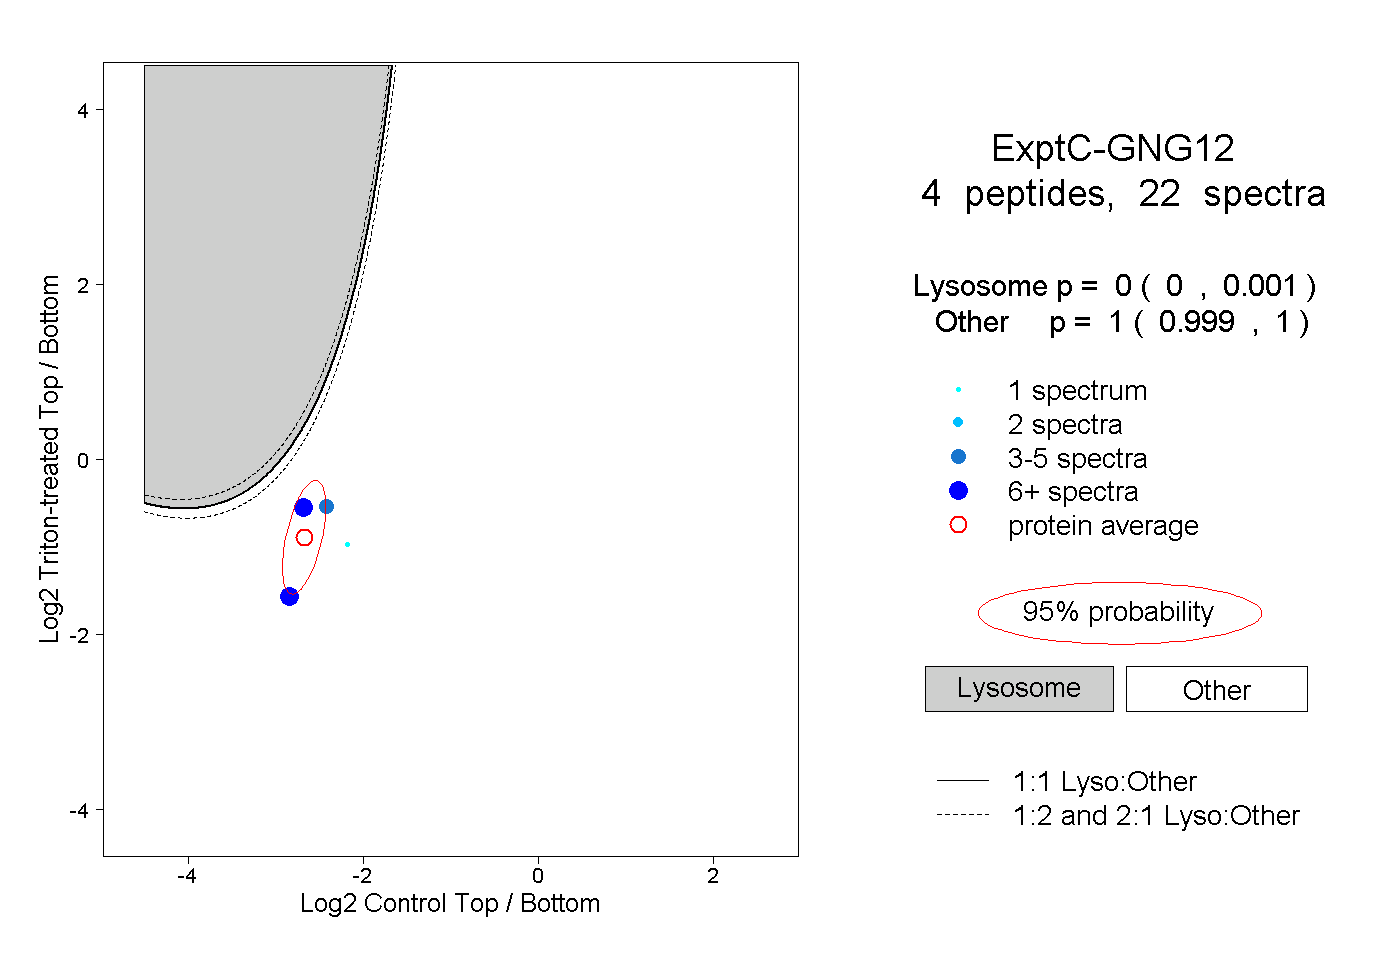 |
0.000 0.000 | 0.001 |
1.000 0.999 | 1.000 |
||||||||
| Plot | Lyso | Other | |||||||||||
| Expt D |
1 peptide |
1 spectrum |
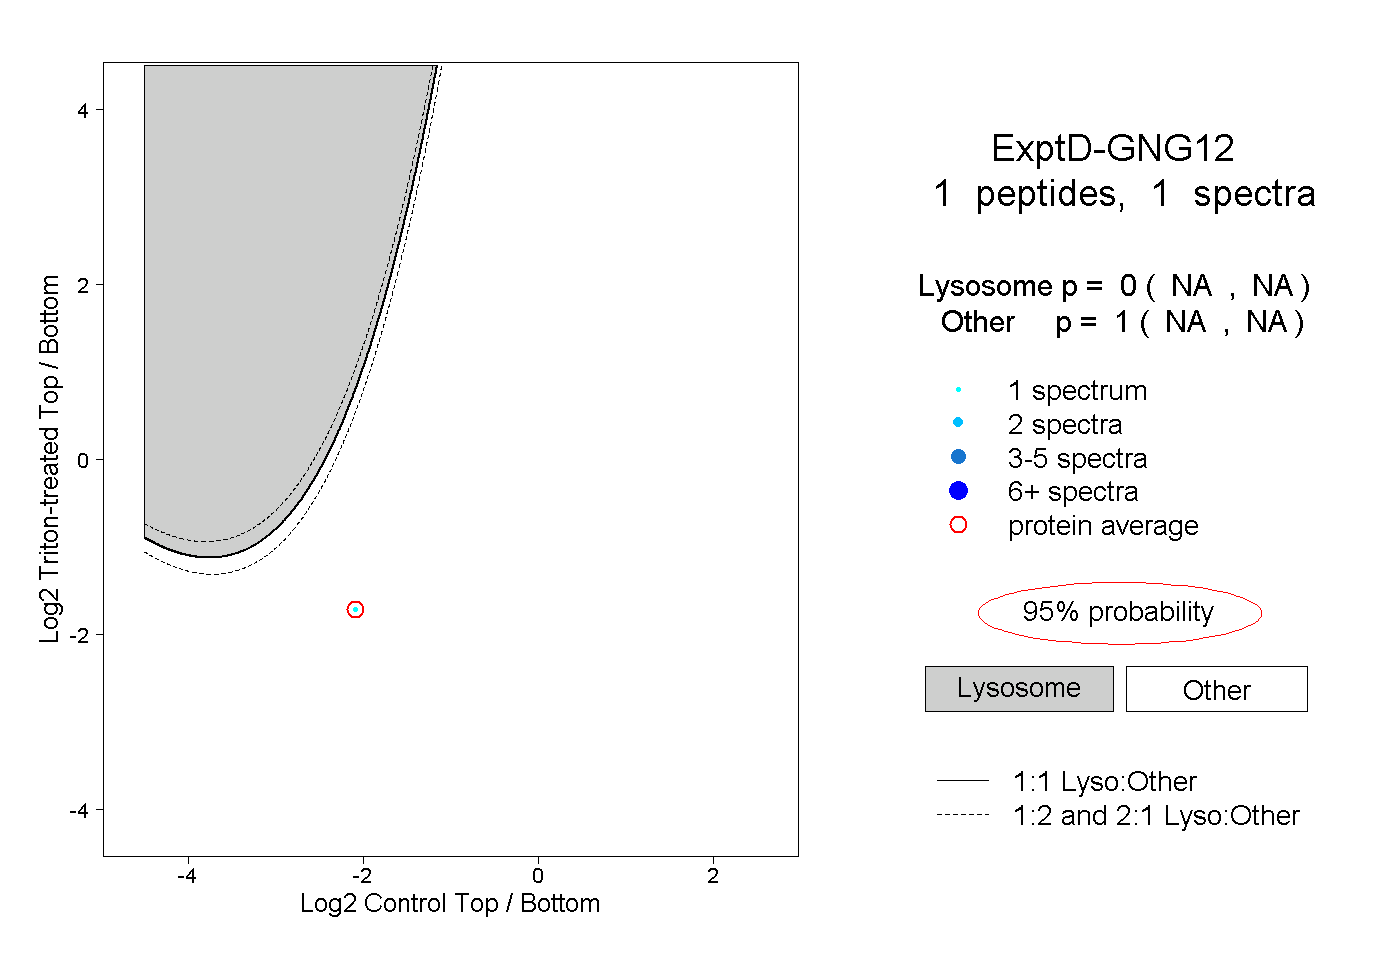 |
0.000 NA | NA |
1.000 NA | NA |