 2
2peptides
spectra
NA | NA
NA | NA
NA | NA
NA | NA
NA | NA
NA | NA
NA | NA
| Plot | Mito | Lyso or Perox | ER | Golgi | PM | Cytosol | Nucleus | ||||||
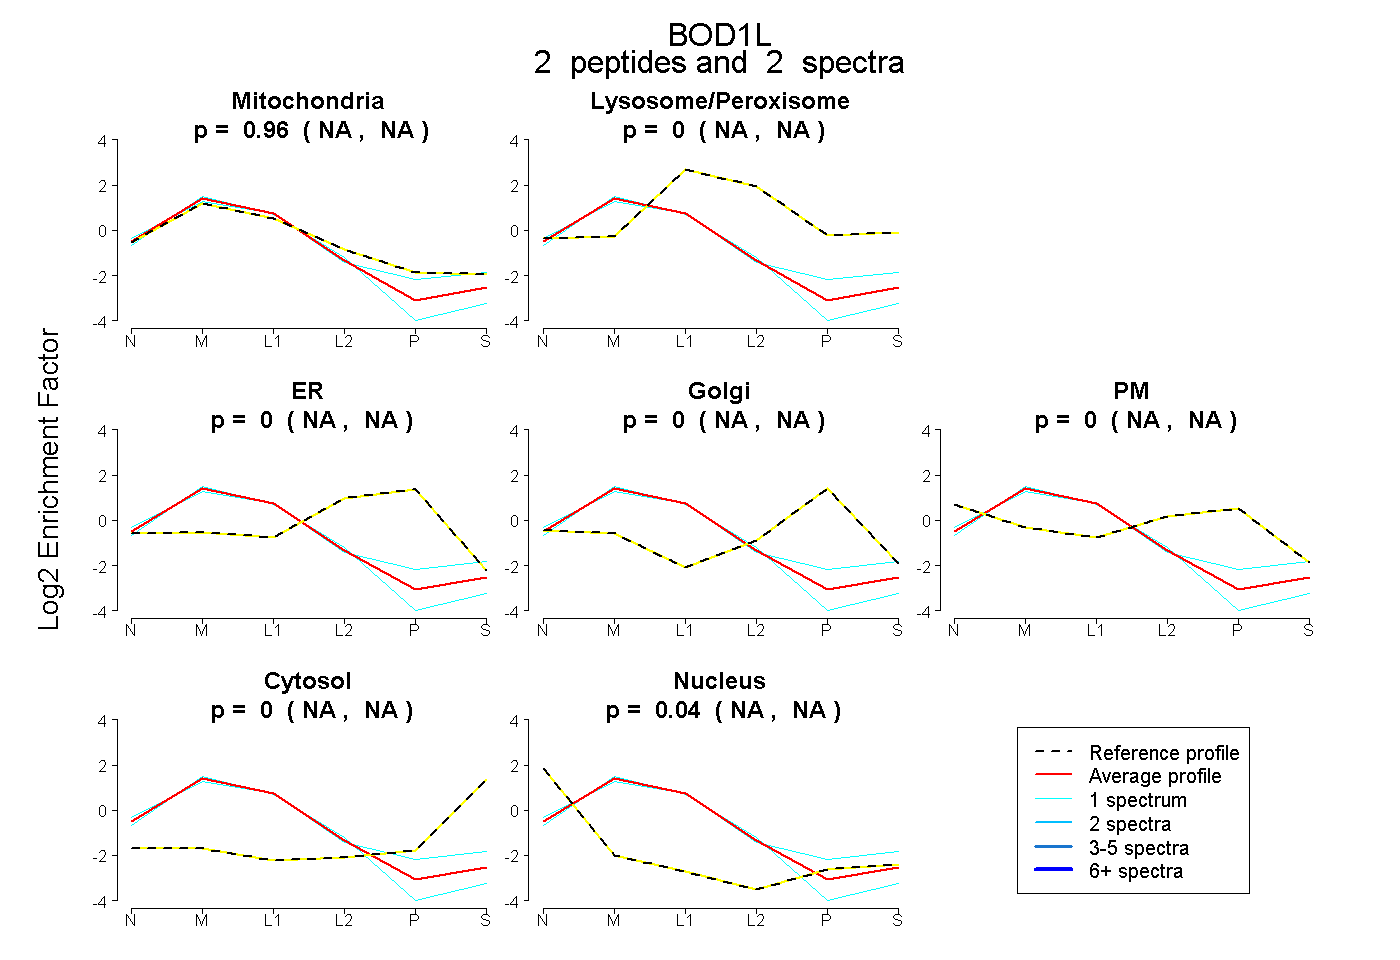
| Expt B |
2 peptides |
2 spectra |
|
0.963 NA | NA |
0.000 NA | NA |
0.000 NA | NA |
0.000 NA | NA |
0.000 NA | NA |
0.000 NA | NA |
0.037 NA | NA |
| 1 spectrum, AAEGTK | 0.964 | 0.000 | 0.000 | 0.000 | 0.000 | 0.000 | 0.036 | |||
| 1 spectrum, ANGSGK | 0.962 | 0.000 | 0.000 | 0.000 | 0.000 | 0.000 | 0.038 |
| Plot | Lyso | Other | |||||||||||
| Expt C |
2 peptides |
8 spectra |
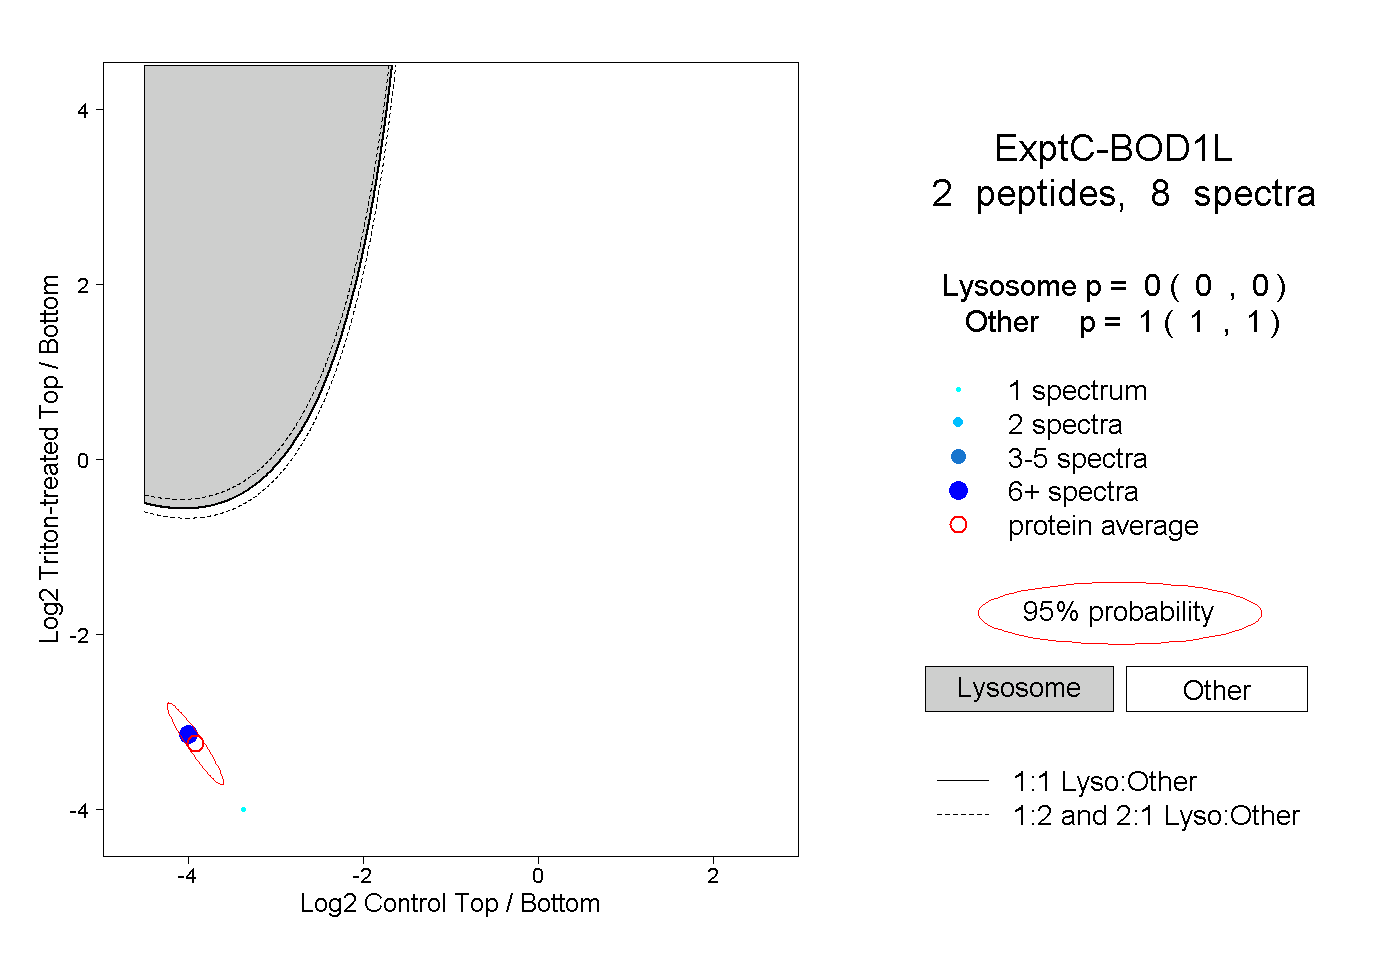 |
0.000 0.000 | 0.000 |
1.000 1.000 | 1.000 |