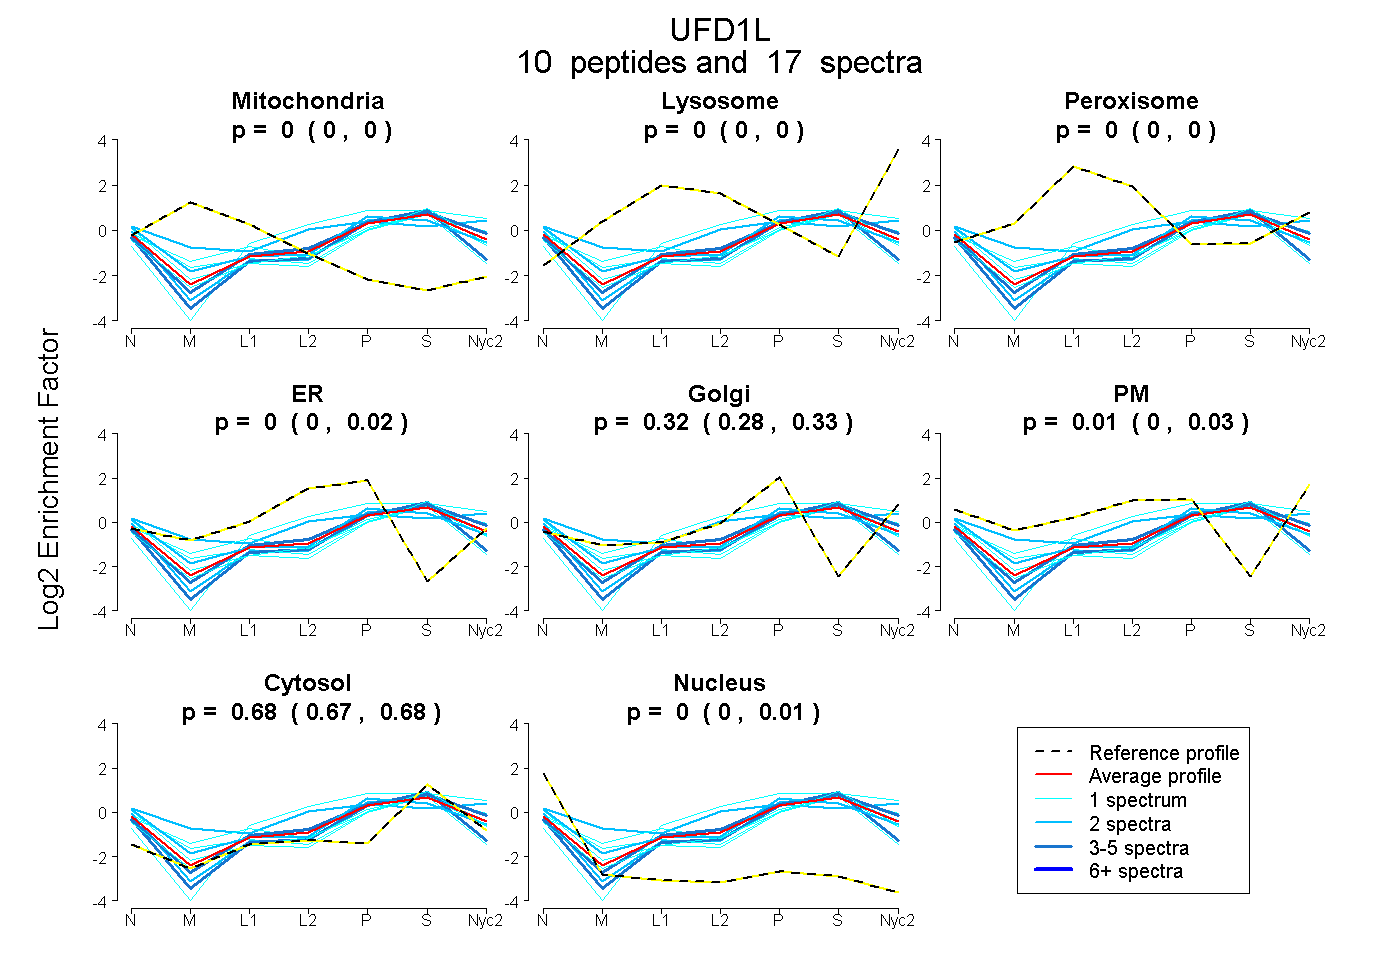
 10
10peptides
spectra
0.000 | 0.000
0.000 | 0.000
0.000 | 0.000
0.000 | 0.022
0.282 | 0.325
0.000 | 0.031
0.667 | 0.684
0.000 | 0.005
| Plot | Mito | Lyso | Perox | ER | Golgi | PM | Cytosol | Nucleus | |||||
| Expt A |
10 peptides |
17 spectra |
|
0.000 0.000 | 0.000 |
0.000 0.000 | 0.000 |
0.000 0.000 | 0.000 |
0.000 0.000 | 0.022 |
0.316 0.282 | 0.325 |
0.007 0.000 | 0.031 |
0.677 0.667 | 0.684 |
0.000 0.000 | 0.005 |
| 1 spectrum, IIMPPSALDQLSR | 0.000 | 0.000 | 0.000 | 0.000 | 0.211 | 0.053 | 0.664 | 0.072 | ||
| 2 spectra, FVAFSGEGQSLR | 0.000 | 0.000 | 0.000 | 0.000 | 0.283 | 0.000 | 0.687 | 0.030 | ||
| 3 spectra, MFSFNMFDHPIPR | 0.000 | 0.000 | 0.000 | 0.000 | 0.286 | 0.029 | 0.685 | 0.000 | ||
| 1 spectrum, CFSVSMLAGPNDR | 0.008 | 0.000 | 0.000 | 0.109 | 0.116 | 0.000 | 0.659 | 0.108 | ||
| 1 spectrum, VMETKPDK | 0.000 | 0.000 | 0.000 | 0.000 | 0.201 | 0.000 | 0.768 | 0.030 | ||
| 1 spectrum, LNITYPMLFK | 0.000 | 0.000 | 0.024 | 0.000 | 0.130 | 0.201 | 0.645 | 0.000 | ||
| 1 spectrum, FQPQSPDFLDITNPK | 0.000 | 0.061 | 0.000 | 0.135 | 0.171 | 0.000 | 0.633 | 0.000 | ||
| 2 spectra, FSTQYR | 0.000 | 0.000 | 0.000 | 0.000 | 0.000 | 0.522 | 0.478 | 0.000 | ||
| 2 spectra, NSRPMVK | 0.000 | 0.000 | 0.000 | 0.000 | 0.389 | 0.012 | 0.561 | 0.038 | ||
| 3 spectra, GIPNYEFK | 0.000 | 0.000 | 0.000 | 0.028 | 0.150 | 0.000 | 0.749 | 0.073 |
| Plot | Mito | Lyso or Perox | ER | Golgi | PM | Cytosol | Nucleus | ||||||
| Expt B |
2 peptides |
4 spectra |
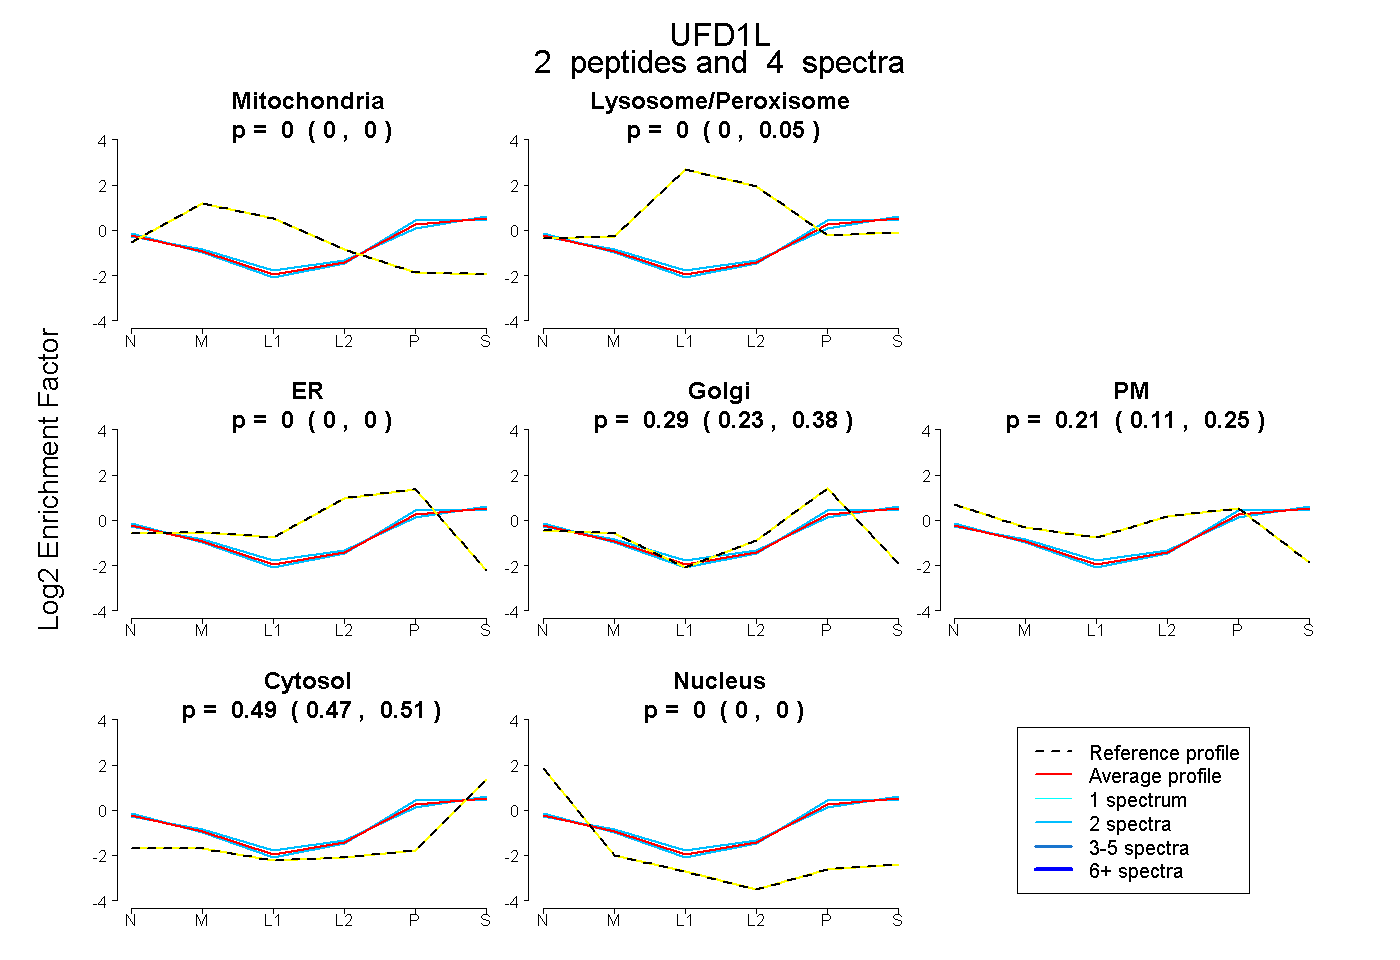 |
0.000 0.000 | 0.000 |
0.000 0.000 | 0.047 |
0.000 0.000 | 0.000 |
0.293 0.234 | 0.382 |
0.215 0.112 | 0.252 |
0.492 0.468 | 0.506 |
0.000 0.000 | 0.000 |
|||
| Plot | Lyso | Other | |||||||||||
| Expt C |
5 peptides |
13 spectra |
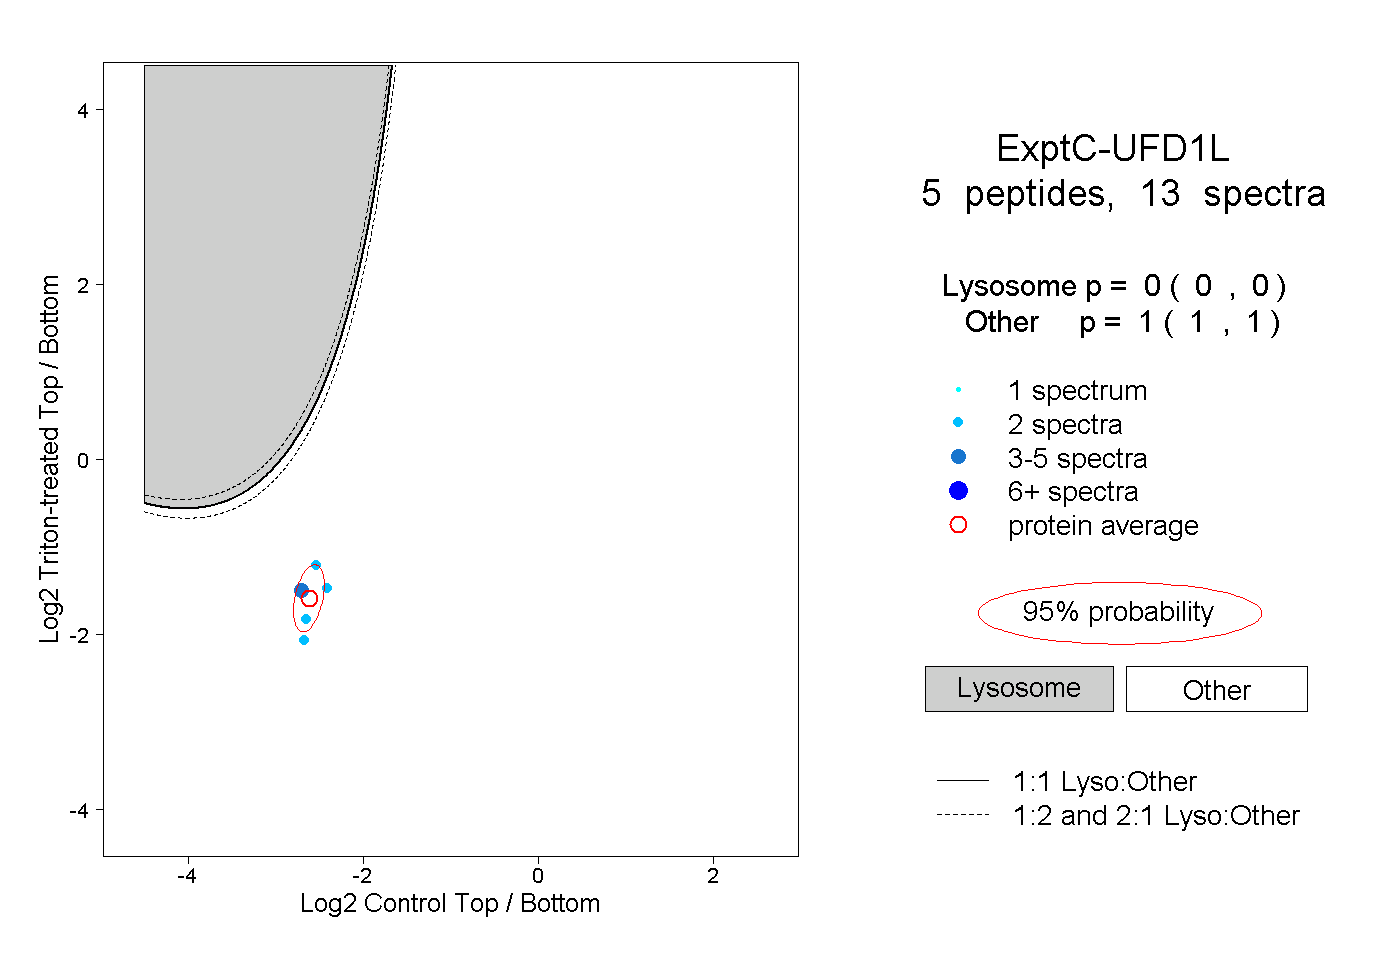 |
0.000 0.000 | 0.000 |
1.000 1.000 | 1.000 |