 37
37peptides
spectra
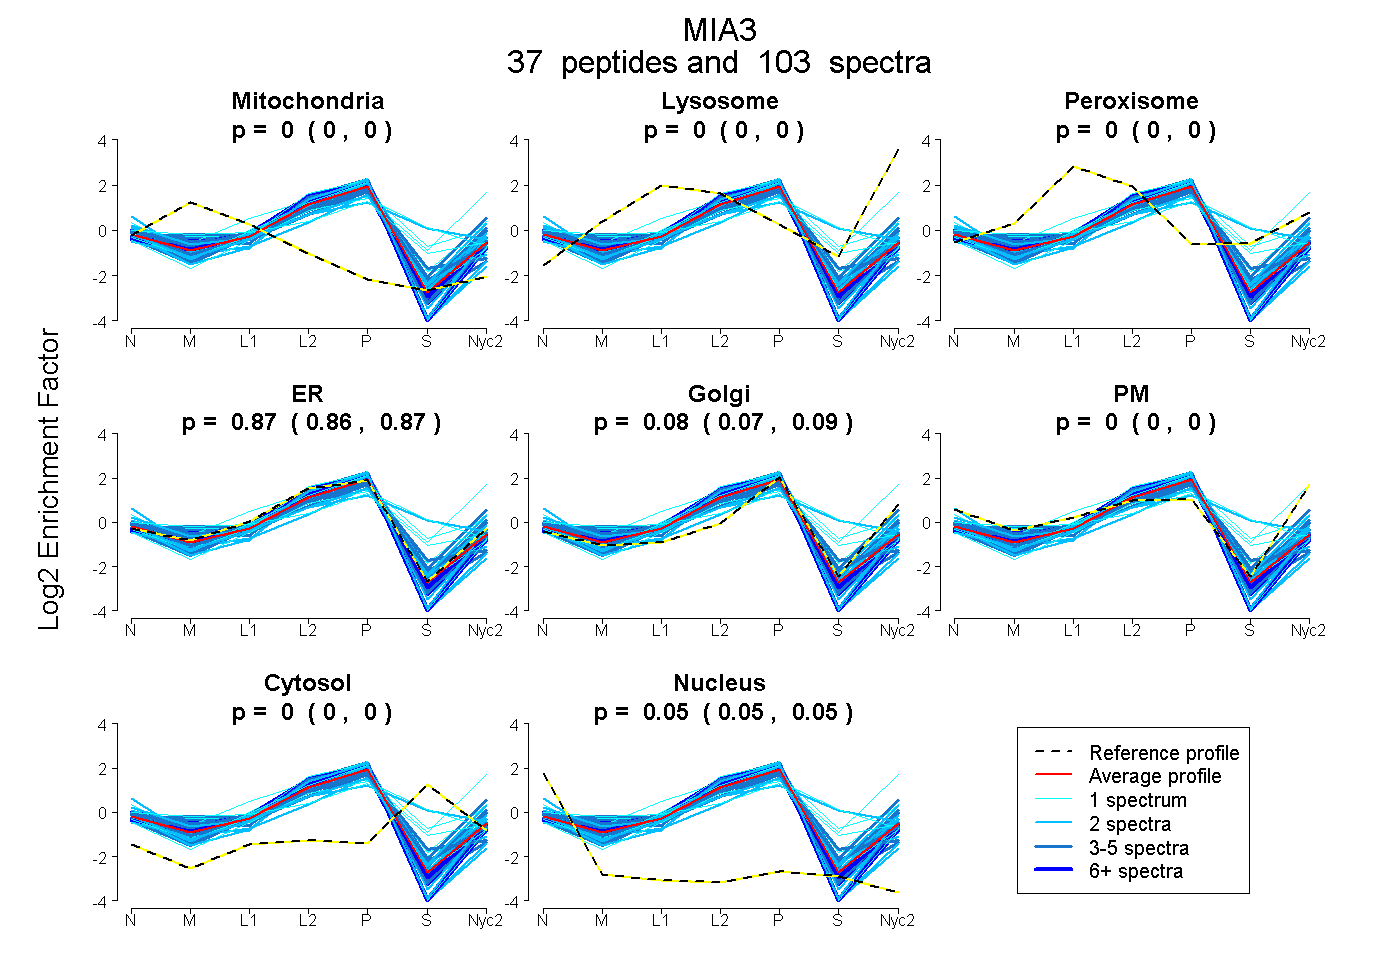
0.000 | 0.000
0.000 | 0.000
0.000 | 0.000
0.864 | 0.874
0.073 | 0.086
0.000 | 0.000
0.000 | 0.000
0.049 | 0.052
13peptides
spectra
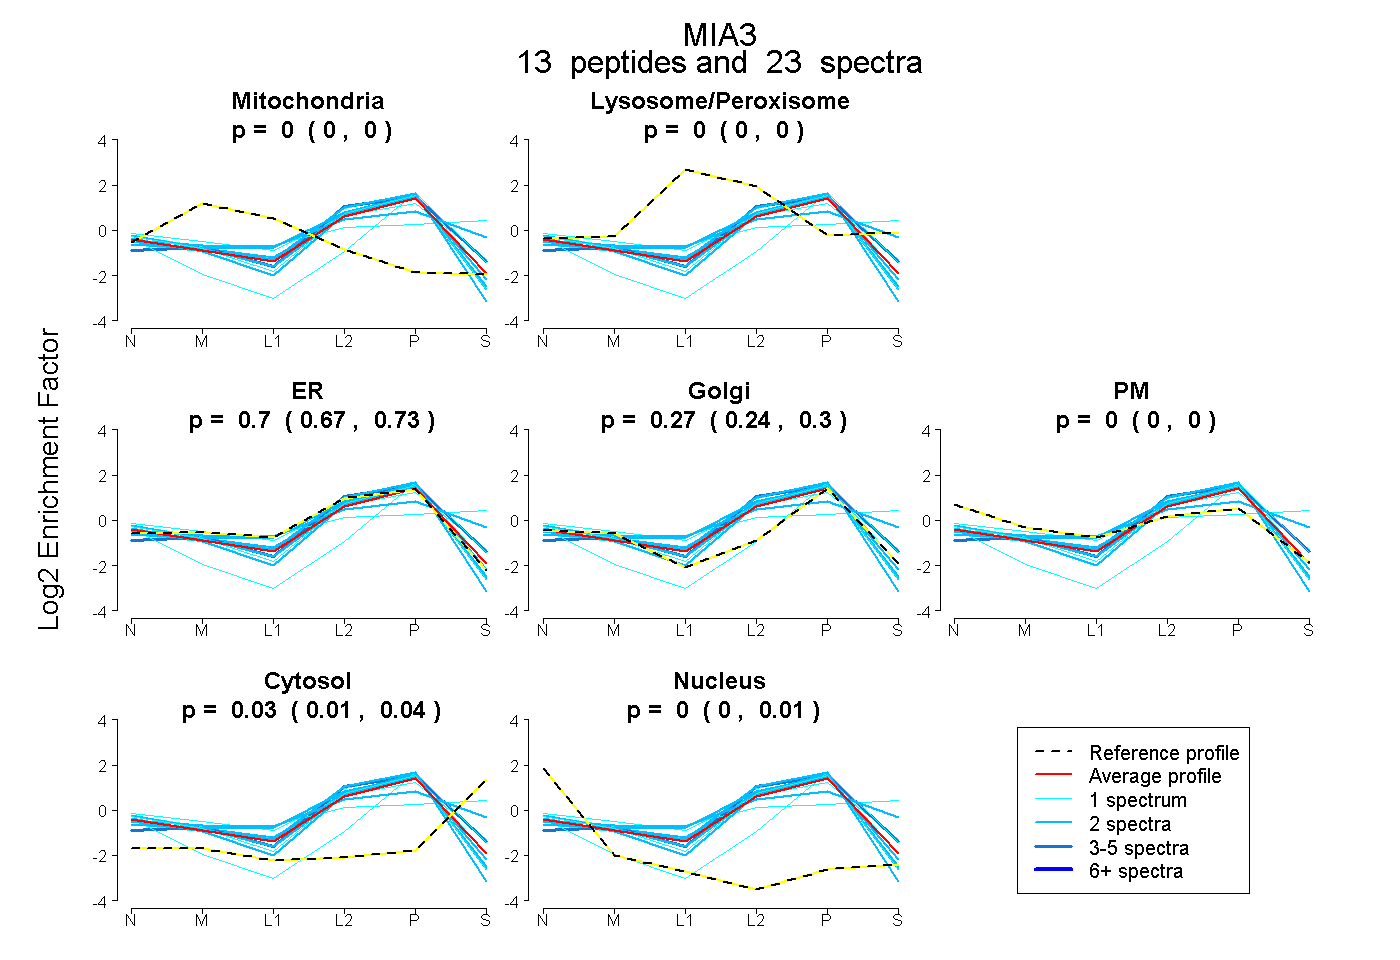
0.000 | 0.000
0.000 | 0.000
0.675 | 0.728
0.235 | 0.299
0.000 | 0.000
0.008 | 0.041
0.000 | 0.008
34peptides
spectra
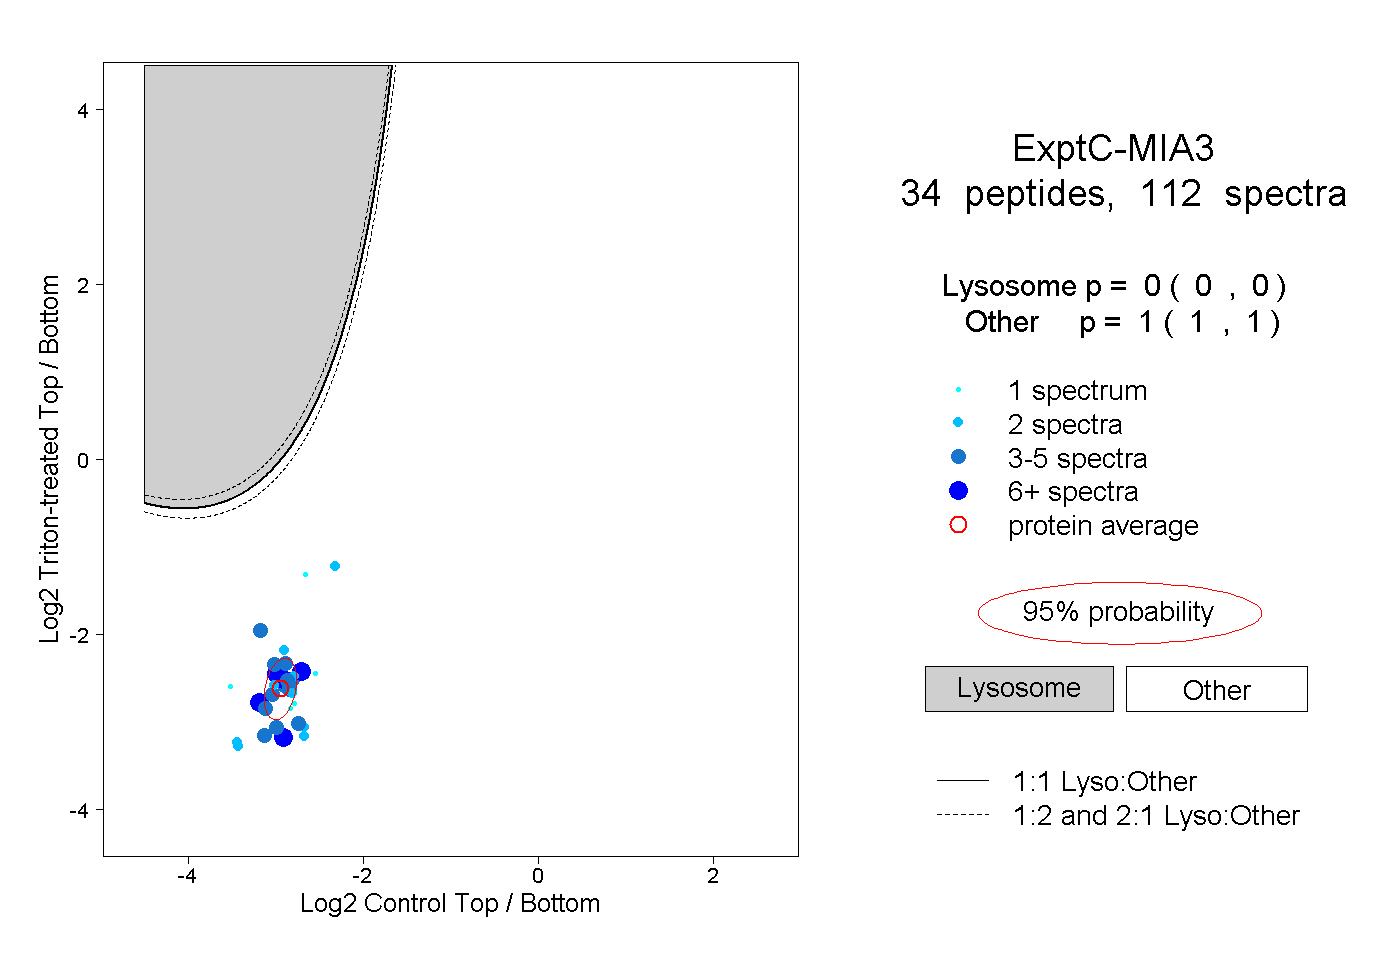
0.000 | 0.000
1.000 | 1.000
13peptides
spectra
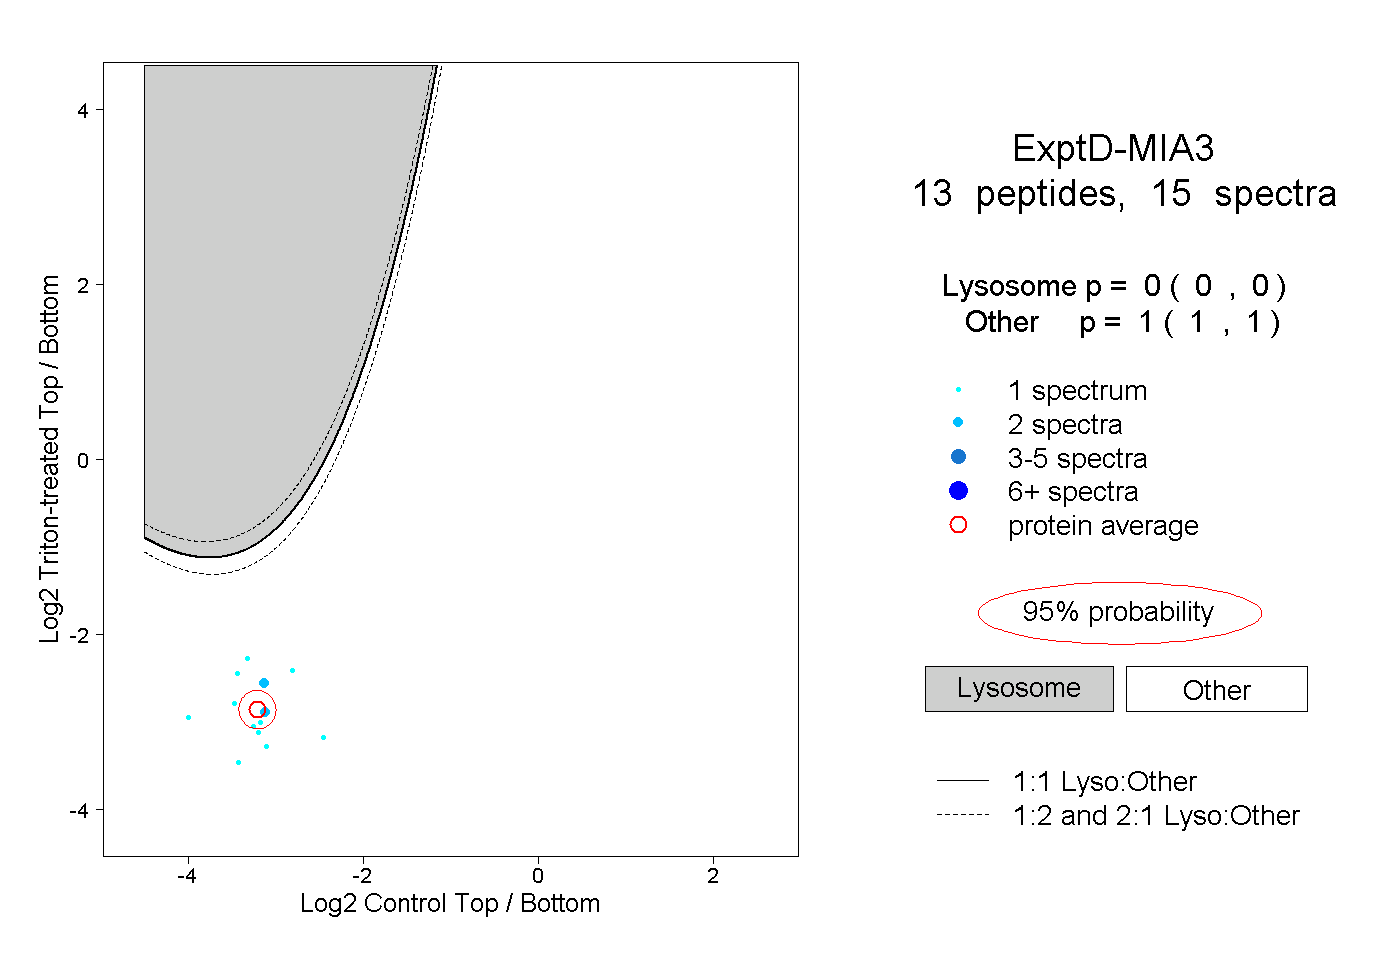
0.000 | 0.000
1.000 | 1.000