MIA3
[ENSRNOP00000067079]
Main page
| | | Plot |
Mito |
Lyso |
|
Perox |
ER |
Golgi |
PM |
Cytosol |
Nucleus |
|
| Expt A |
 37
37
peptides |
103
spectra |
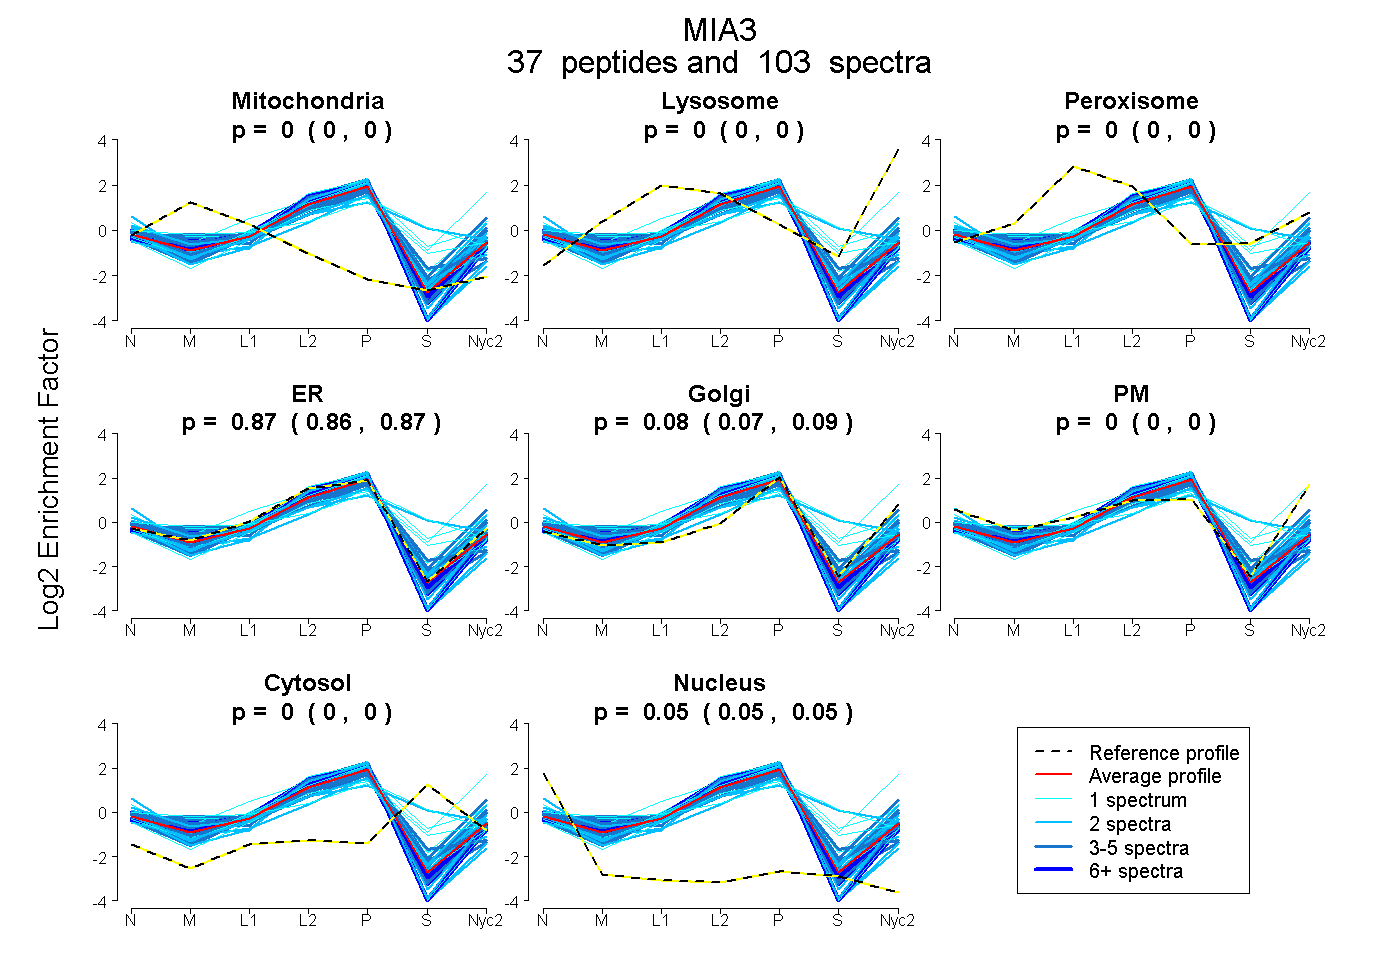 |
0.000
0.000 | 0.000 |
0.000
0.000 | 0.000 |
|
0.000
0.000 | 0.000 |
0.869
0.864 | 0.874 |
0.080
0.073 | 0.086 |
0.000
0.000 | 0.000 |
0.000
0.000 | 0.000 |
0.051
0.049 | 0.052 |
|
| | | Plot |
Mito |
|
Lyso or Perox |
|
ER |
Golgi |
PM |
Cytosol |
Nucleus |
|
| Expt B |
13
peptides |
23
spectra |
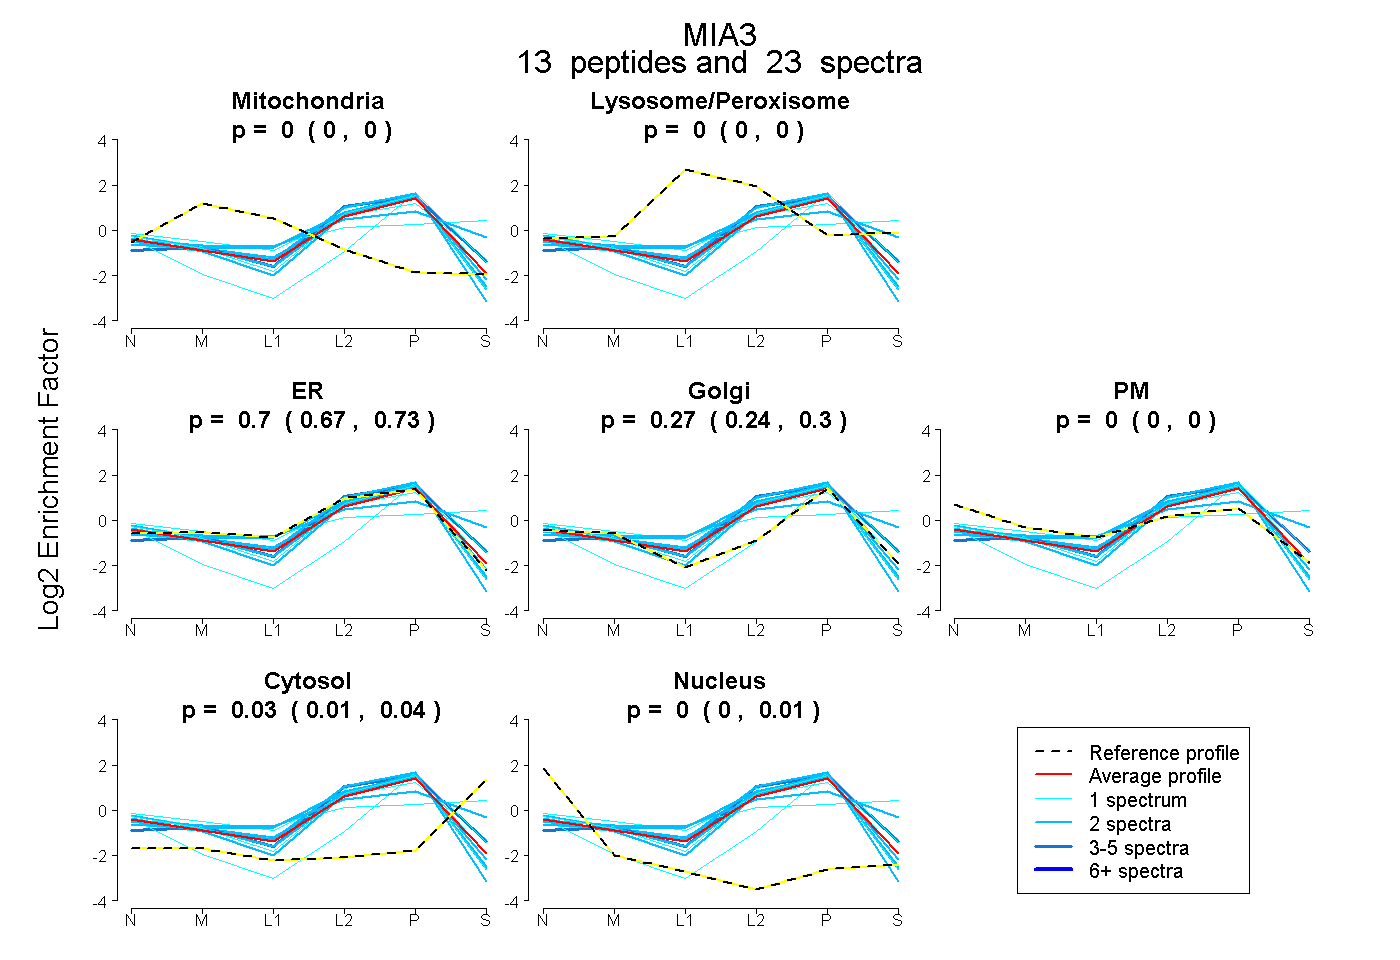 |
0.000
0.000 | 0.000 |
|
0.000
0.000 | 0.000 |
|
0.702
0.675 | 0.728 |
0.271
0.235 | 0.299 |
0.000
0.000 | 0.000 |
0.027
0.008 | 0.041 |
0.000
0.000 | 0.008 |
|
| 2 spectra, ATPEIPDIVLK |
0.000 |
|
0.000 |
|
0.824 |
0.176 |
0.000 |
0.000 |
0.000 |
|
| 2 spectra, VVLAAEEVK |
0.000 |
|
0.000 |
|
0.925 |
0.075 |
0.000 |
0.000 |
0.000 |
|
| 2 spectra, SHAELTEQIR |
0.000 |
|
0.280 |
|
0.239 |
0.310 |
0.000 |
0.171 |
0.000 |
|
| 1 spectrum, VQEENAR |
0.000 |
|
0.000 |
|
0.657 |
0.343 |
0.000 |
0.000 |
0.000 |
|
| 1 spectrum, CNLEDQIK |
0.000 |
|
0.127 |
|
0.431 |
0.249 |
0.164 |
0.029 |
0.000 |
|
| 4 spectra, ELEGLLQDMSIK |
0.000 |
|
0.000 |
|
0.826 |
0.081 |
0.000 |
0.092 |
0.000 |
|
| 2 spectra, AGLEDECK |
0.000 |
|
0.000 |
|
0.798 |
0.173 |
0.000 |
0.000 |
0.029 |
|
| 1 spectrum, DDQQSLYR |
0.000 |
|
0.000 |
|
0.860 |
0.126 |
0.000 |
0.014 |
0.000 |
|
| 1 spectrum, SEFGSLDR |
0.000 |
|
0.000 |
|
0.000 |
0.899 |
0.000 |
0.089 |
0.012 |
|
| 1 spectrum, ENPSDLQK |
0.000 |
|
0.331 |
|
0.000 |
0.216 |
0.144 |
0.309 |
0.000 |
|
| 2 spectra, LSQEEYER |
0.000 |
|
0.000 |
|
0.601 |
0.399 |
0.000 |
0.000 |
0.000 |
|
| 2 spectra, LSSYEQK |
0.000 |
|
0.000 |
|
0.710 |
0.281 |
0.000 |
0.000 |
0.010 |
|
| 2 spectra, VILGTLNLNTEK |
0.000 |
|
0.000 |
|
0.936 |
0.062 |
0.000 |
0.003 |
0.000 |
|
| | | Plot |
|
Lyso |
|
|
|
|
|
|
|
Other |
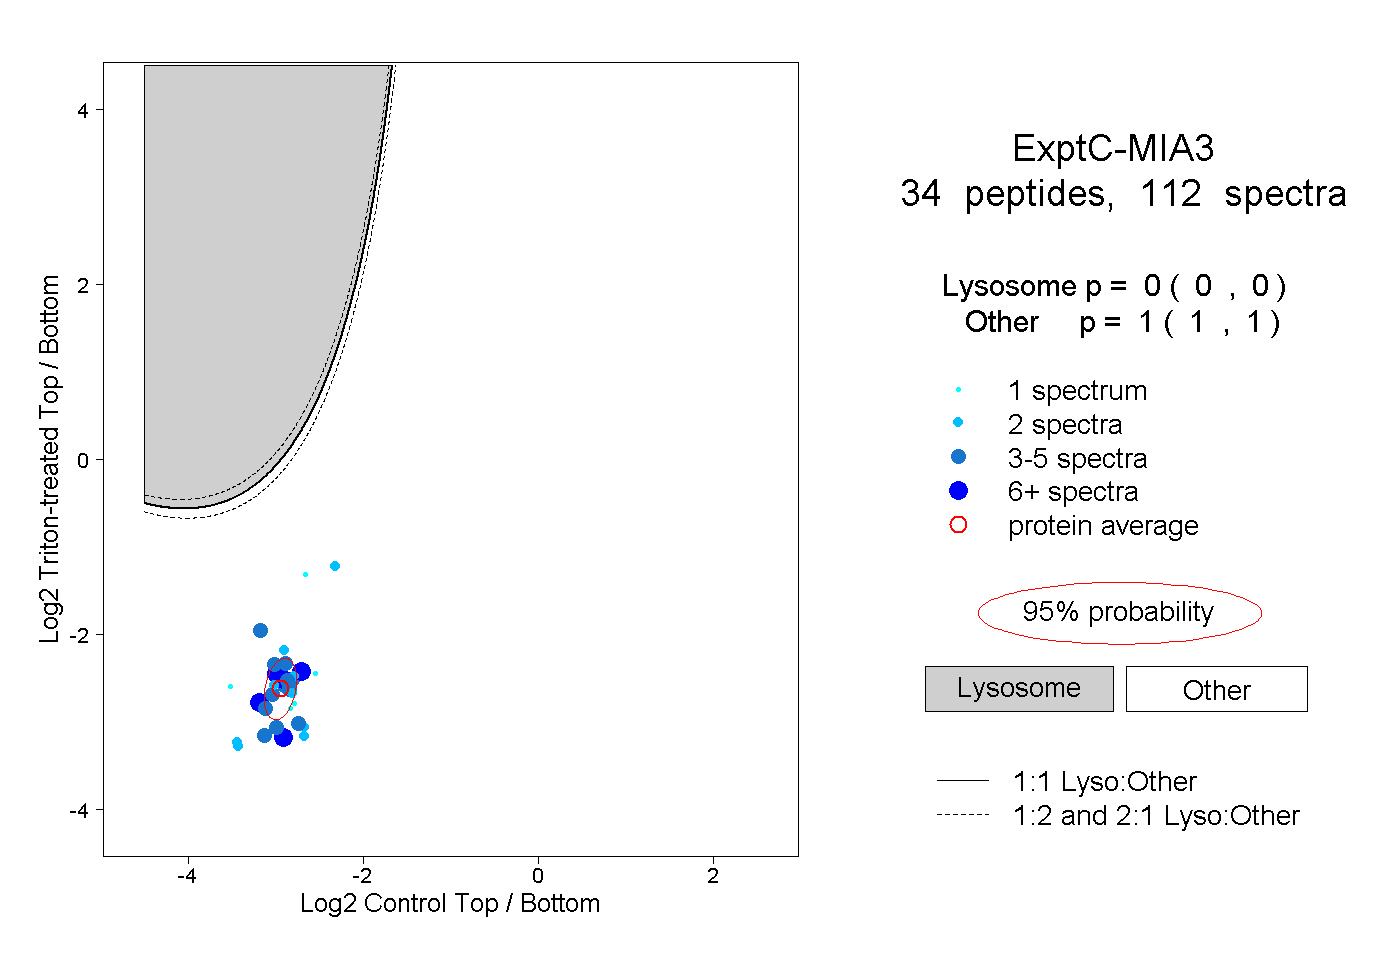
| Expt C |
34
peptides |
112
spectra |
 |
|
0.000
0.000 | 0.000 |
|
|
|
|
|
|
|
1.000
1.000 | 1.000 |
| | | Plot |
|
Lyso |
|
|
|
|
|
|
|
Other |
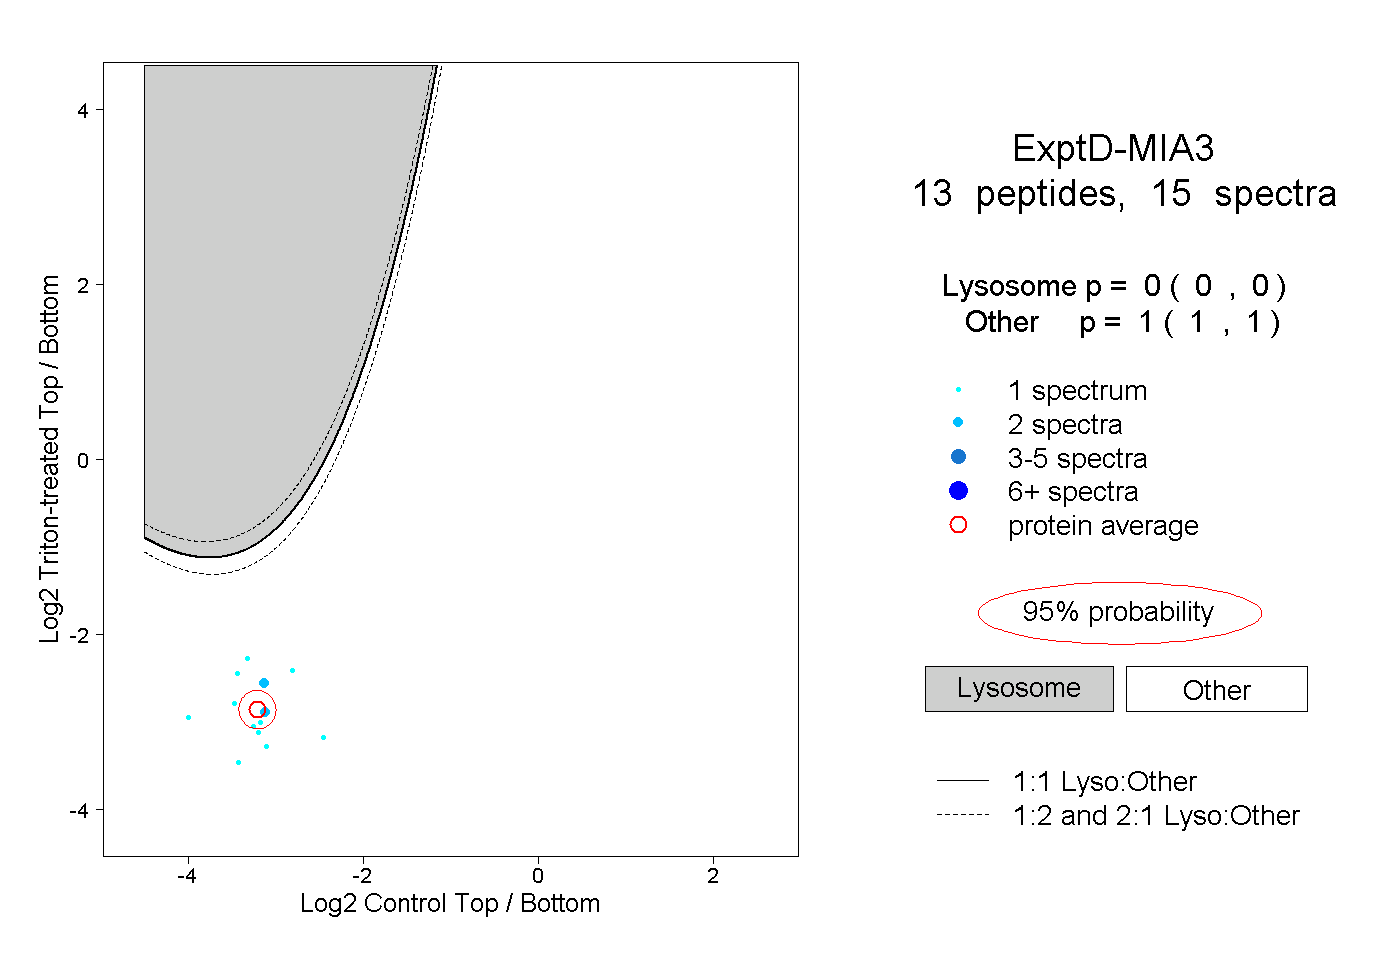
| Expt D |
13
peptides |
15
spectra |
 |
|
0.000
0.000 | 0.000 |
|
|
|
|
|
|
|
1.000
1.000 | 1.000 |